My podcast today is all about heat waves.
Let's start with the great heat wave dilemma that is never properly explained in the media:
The Northwest is slowly warming from human-caused climate change but extreme heat waves are NOT increasing in our region.
How can that be?
First, let me prove it.
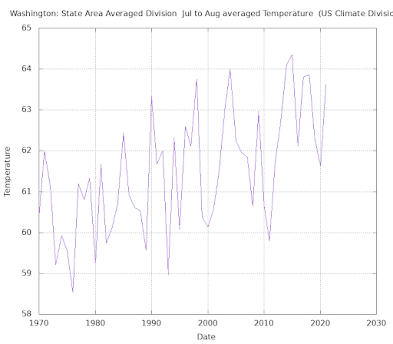
Here are the summer (July-August) temperatures over Washington State for the past fifty years. An increase of about 2F over the period.
With warming over the period, the frequency of getting above some threshold like 80 or 90F is increasing. The Seattle Times did a heat wave story a few days ago and showed this (see below from the ST). As expected, in Seattle there are more days above 90F as we slowly warm.


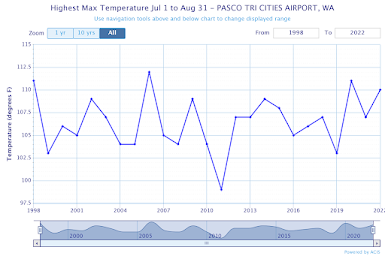
Just to check on the Seattle Times... I did the same thing for July and August over the past 50 years, plotting the warmest observed temperature at both SeaTac and Pasco (see below).
Hardly any change in the extreme high temperatures each year at either site. No long-term trend....and you would expect a trend if global warming was important for the extreme heat waves!

To listen to my podcast, use the link below or access it through your favorite podcast service.


I'm just curious as to how many of these years had a long string of Back to back mid to upper 90's and close to 100 degrees (olympia area) all in a row like were having now ?, scattered throughout the summer is one thing but this is over the top say's a guy who has spent most all summer working outdoors for the last 40 years.
ReplyDeleteApparently, quite a few:
DeleteMaximum 2-Day Mean Max Temperature
for OLYMPIA AP, WA
Click column heading to sort ascending, click again to sort descending.
1 107.5 2021-06-28 0
2 103.5 2021-06-27 0
3 103.0 1981-08-10 0
- 103.0 1941-07-16 0
5 102.5 2009-07-29 0
6 101.5 1942-07-01 0
- 101.5 1941-07-17 0
8 101.0 1981-08-11 0
- 101.0 1981-08-09 0
- 101.0 1942-07-02 0
Period of record: 1941-05-13 to 2022-07-28
Vxdude mentioned a long string of days, not two. If the forecast holds up, Sunday will give us 6 straight days of 90+ highs at SeaTac.
DeleteSeattle Viewing Space. Sorry...when he said back to back I thought he mean two days. Six days is unprecedented...we have done 5, never 6 before. This is consistent withe the steady warming we have observed..cliff
DeleteTHIS IS AN EXCELLENT PODCAST!!!!!!!!!!!!!!
DeleteDifferent approach - if you look at daily maximums for Seatac in NOAA's GHCNd dataset and take out the seasonal cycle, you can see that the number of +3SD max temperatures in a 10 year period has doubled in the last 10 years. Same for +2SD, +3.5, etc. You appear to be plotting *summer* averages which, of course wouldn't show this. 5 years of a summer with every day at Seatac around 90 degF wouldn't change that trend line at all!
ReplyDeleteI'd post a plot but it doesn't look I can do that here.
Fred..there are means and extremes.... I showed both in my blog. Send me you plots. Doubled in the last ten years over what?..cliff
DeleteIf you are interested in extreme high temperature events then you certainly don't want to limit the analysis to two months in summer. That's when they are most noticeable, of course, but the question I'm trying to answer is : is the probability of an extreme (and you can define that however you want, but > +2 or +3 standard deviations seems reasonable) event changing with time? One way to do that is to remove the seasonal cycle and bin the count of the number of days in, say, a 10 year period, where the *residuals* after removing the seasonal cycle are > +2 or +3 std from the mean.
DeleteIf I do that for 2.5 std (~17 degF), the number of days that exceeded that limit from 2011-2021 (79) were roughly 2x that of 2001-2011 (43) and flat before that (from 1951). It's even more dramatic for London - from 1951-1961 there were 14 such events and from 2011-2021 there were 52.
I'm sure someone must have done this more comprehensively, but I find it suggestive.
Fred...there is a problem with that approach--an issue I discussed in my previous blogs last summer. Considering the relatively gaussian nature of the temp distribution, if there is even a small warming, you can a huge increase in the number of events beyond..say 3 std.. even with a small warming. You can get crazy numbers this way, with even a slight warming..cliff
DeleteCliff ... that's exactly my point! The *probability* of (formerly) *rare* events increases dramatically with a small change in temperature. The probability of a 100F day in July and August increases by 3 fold with a 1 degC. It's nonlinear due to the shape of the probit (inverse cdf). https://en.wikipedia.org/wiki/Quantile_function
DeleteFred...what you say is true...but it is meaningless. You can warm the mean by .1 F and shift the distribution over and increase the small probability over 3 std by 500 times! But what does that mean? Nothing really. Sounds impressive by you still only warmed things by .1F...cliff
DeleteDr. Mass:
ReplyDeleteI believe that your prognosis that a local warming issue is at least partly to blame is right on. I saw the same article which prompted me to do some research and correspond with the author. It appears that the official weather station for the data upon which this report is based is the NWS station that was moved from downtown Seattle to SeaTac Airport over 70 years ago. It is now situated toward the south end of field, between two active runways and surrounded by acres of pavement. Not ideal on that criteria alone, but I would guess that the aircraft passing nearby very frequently can only be imparting an additional warming bias.
This station is ideally suited for airport operations, but far less than ideal for creating an accurate temperature record. Additionally, the expansion of the SeaTac Airport over the past 70 years raises serious questions regarding the integrity of the temperature record.
The Port of Seattle folks sent me an aerial photo showing the location of the station (actually there is a substation as well) on the airport grounds. If you want a copy, just let me know.
Thanks
Seems NOAA is consistently breaking their own rules for temperature station. In 2009 89% were located in heat islands. The latest report I read that number has increased to 96%. https://www.heartland.org/_template-assets/documents/publications/2022_Surface_Station_Report.pdf
DeleteHow can we derive a "trend" from 50-70 years of data? The period during the Roman Empire is estimated to be warmer than today!
ReplyDeleteWhy did NOAA remove the temperature records from before 1880? Is it because they don't want people to be aware of the heatwave of 1878? Why did James Hansen start using 14 degrees celcius as the mean temperature of the Earth instead of 15? https://www.americanthinker.com/articles/2012/11/fourteen_is_the_new_fifteen_comments.html Why did Australia delete temperature records from before 1910? Why are they purposefully diverting water from Albuquerque then getting all the fake news MSM reporting on the "worst drought" ever! https://www.youtube.com/watch?v=kFsDTn7N9J8
Delete"They" sure do stay busy. And organized. Why is it the same people who see government as the epitome of incompetence are willing to credit them with a decades long, multinational, laser-focused conspiracy to do bad bad things?
DeleteI would be curious to see records for rural areas that have not experienced notable population gains to eliminate concerns about distortions from urbanization. For example, Rockport, Darrington or Morton in the Cowlitz.
ReplyDeleteA 2 degrees increase in max temps during a heat wave seems small at first look. But after learning about the fragile ecosystems in the Arctic, I wonder about "fragile" humans in urban areas. As 2nd generation Seattlite, I can say that Seattle residents have traditionally suffered thru heat waves without air conditioning. Humans have a natural body temp of 97 to 98 F. I question how long humans can withstand sustained indoor temps approaching 90 F. My point is that 2 deg F increase from climate change is not trivial for vulnerable humans on the edge. At some point, a major change in infrastructure will be required for Northern cities to remain healthy in July and August.
ReplyDeletevulnerable folks should get AC.
DeleteAnd we all know that "vulnerable folks" definitely have lots of disposable income for things like AC.
DeleteThere is no reason the virtually everyone can't have AC. In Houston, Atlanta and Miami it is 99% by the way. Room AC is not that expensive and society can help low-income folks with the costs. University AC will greatly reduce heat deaths and injury. We can do this. A lot easier to accomplish than many other challenges...
DeleteWhy should society subsidize air conditioning so people can live in the desert?
DeleteI won't argue one way or the other about Cliff's statement that extreme heat waves are not becoming more frequent, but I want to note this about the latest heat wave here in Wenatchee. These are observations from the Tree Fruit Research Center in Wenatchee, where the temperature measuring site is in a semi orchard environment that has changed very little since measurements began there in the late 1930s. Last June saw the highest temperatures of record at this site, with the warmest day reaching 116 and four days at or above 110. The previous record was 108 observed in August 1961. This July heatwave has brought the hottest July day of record (as of today), 110 beating the previous record of 107 set during several past Julys. So we have equaled or exceeded the previous hottest day during two consecutive summers. This current run of hot days, now going into its 7th day tomorrow (Saturday), is the longest stretch of consecutive very warm days (days above 100) of record at this site. We talk a lot about daytime hot temperatures but not much has been said about how much warmer our night temperatures have become in recent years and I would like Cliff to address the causes of this sometime.
ReplyDeleteI was gratified to see that one of your graphs of past max daily temps in Seattle matched my now old-man memory of the summer of 1958....I remember my dad checking out an outdoor thermometer in our backyard, a few blocks north of Greenlake....in the shade, the reading was 102 degrees!....we were astonished...but the official reading (at SeaTac?) was 99 degrees...I can remember playing my Little League baseball games in a very hot summer, that year.
ReplyDelete96% of the official NOAA weather stations are placed in locations that corrupt their temperatures. How much of the 2-deg F temperature rise is due to heat-island biases? The satellite data from the past 43-years shows little heating. It shows long pauses with step changes in between the pauses. The current pause is nearly 8-years long and averages about 0.2- to 0.25-deg C above the 91'-20' baseline.
ReplyDeleteThe overall slope of these temperatures is about 0.13-deg C/decade. The worthless climate model predictions are 0.35-deg C/decade. That's the about the same value that James Hansen scared the nation with in his 1988 Senate testimony. His background was Venusian climate where CO2 is dominate. He's been trying to fit a square peg into a round hole with his obsession with CO2.
https://www.heartland.org/_template-assets/documents/publications/2022_Surface_Station_Report.pdf
https://www.drroyspencer.com/wp-content/uploads/UAH_LT_1979_thru_June_2022_v6.jpg
How about that there's a combination of heating due to CO2 and an increase in many areas due to the heat island effects of urbanization? Either way it's getting hotter.
Delete
DeleteDisagree: This is a peer reviewed paper
"On the reliability of the U.S. surface temperature record" (Menne et al. 2010)
https://www.ncei.noaa.gov/pub/data/ushcn/papers/menne-etal2010.pdf
Heat island effects are accounted for. https://climate.nasa.gov/ask-nasa-climate/3071/the-raw-truth-on-global-temperature-records/
DeleteSVP... These folks may think everything is fine, but there are several studies have shown the problems with exposure/instrumentation HAVE contributed to a part of the warming signal. I saw this first hand at SEA TAC airport when the third runway was built. Check out my blog on the issue:
Deletehttps://cliffmass.blogspot.com/2011/07/did-sea-tacs-third-runway-change-our.html
..cliff
Care to share links to those studies? I would also be interested in reading any rebuttals to those studies. Is this an issue at weather stations all around the world or just ones operated by NOAA.
DeleteYou bet....take a look at this by Anthony Watts...he has worked on this issue for decades and published in the peer-reviewed literature on it.
Deletehttps://www.heartland.org/_template-assets/documents/publications/2022_Surface_Station_Report.pdf
Seattle Viewing Space... if you don't like him because of his background (which I don't think is fair), there are many other references, like https://journals.ametsoc.org/view/journals/bams/88/6/bams-88-6-913.xml Search on Pielke Sr. Very respected meteorologist and Professor Colorado State.
DeleteWho has peer reviewed Anthony Watts? Certainly not the paper you cite.
DeleteConcerned About Climate: Please check out the Pielke et al references noted above and easily find by searching. Some material, same conclusions...cliff
DeleteMenne et al. (2010) (https://agupubs.onlinelibrary.wiley.com/doi/full/10.1029/2009JD013094) isn't the only study to question the 2009 Watts report. In 2013, Richard Muller, himself famously a previous skeptic of global warming and anthropogenic greenhouse gas contributions, and the Berkeley Earth team analyzed the claims of Watts and found that they did not statistically hold up as a whole across the US for monthly mean temperature trends, i.e., the monthly mean temperature increase over the US is robust irrespective of station siting. See http://static.berkeleyearth.org/papers/Station-Quality.pdf. See Hausfather et al. (2013, https://agupubs.onlinelibrary.wiley.com/doi/full/10.1029/2012JD018509) as well. Interestingly, Watts doesn't even mention these studies or many studies since in his 2022 report. He does mention Menne et al. (2010) but instead of providing evidence for their analyses being incorrect, he points out that the study is by NOAA employees, implicitly questioning their objectivity as scientists because of where they work. Take that as you will but science is not well served by ad hominem attacks, and Hausfather and Muller are not NOAA employees (and were in fact funded by the Koch brothers to start, not that it should matter because again, ad hominem attacks are not scientific debate and serve no purpose in finding objective truth based on data).
DeleteStudies generally agree that increasingly urban siting can increase temperature trends, but what Watts doesn't address is that this is statistically correctable across a network over time, which is done in climate datasets, of which there are a good number to intercompare. One can question those corrections, which involve a lot more than just urban warming corrections (e.g., see http://berkeleyearth.org/understanding-adjustments-temperature-data/), and many, many studies have been done on this applying a range of different techniques. The Watts report does not go through any of this or even precisely what data he is plotting in his temperature time series figures.
Now, that doesn't mean that there aren't siting biases for individual stations like SeaTac that are not properly corrected. What it means though is that you cannot draw a conclusion from a single site like that and a broader network without some clearly defined statistical analyses to make that jump including addressing why numerous past studies that already evaluated this issue are incorrect. And of course, this should go through peer review.
Adam...there is also the considerable number of paper by Roger Pielke Sr. and associated that came to a similar conclusion was Watts. Have certainly seen warming here in the NW with badly located stations or ones where sensors failed. SeaTac is a good example with the third runway. The NCDC folks had not a little self interest in making the claim that things are ok. Anyway, check out local sites to see what I mean. Compare olga 2E on Orcas (always rural) and Sea Tac. The former has an increase of 2F since 1950 and SEA has twice that...cliff
DeleteClaiming that scientists published incorrect or misleading analyses based on their perceived interest without showing how their analyses are incorrect or misleading is lazy and weakens trust in the scientific process. The same type of ad hominem logical fallacy has been used over and over to try to discredit climate scientists as a whole - that they are motivated to have certain results to get funding. I'm not saying that hasn't happened in specific cases, but without evidence of such claims for specific cases, one can essentially dismiss all science because we all have biases and interests. In what way is that helpful in advancing debate to try to find truth?
DeleteCertainly, Pielke Sr.'s papers are worthwhile to consider since the methods are clear (as opposed to Watt's non-peer reviewed reports), but it is misleading to consider only 1 side without fairly considering the plethora of studies on the other side. And again, those studies do generally find what is claimed here: that urbanization has increased temperatures at some sites, but again, those raw temperatures are not used in temperature trends so claiming that urbanization is what causes the warming signal in bias-corrected temperature datasets requires analyses of that. Comparing raw SeaTac data to a rural site also doesn't prove anything for this exact reason. This study from 2011 with Watts and Pielke Sr. as coauthors indeed shows that the average temperature trend adjusted for biases is not impacted by urbanization: https://agupubs.onlinelibrary.wiley.com/doi/full/10.1029/2010JD015146, and the original comment above is referencing the average temperature trend, not mins or maxes, which have more uncertain trends and more debatable.
Of course, that original siting debate is now a decade old, and studies such as this one (https://agupubs.onlinelibrary.wiley.com/doi/full/10.1002/2015GL067640) have shown that USHCN (the dataset in question) average temperature trends agree with the newer USCRN network that has only rural siting specifically designed to avoid urban siting biases. Is there a recent peer-reviewed study that shows that bias-corrected average temperature datasets do not properly handle urban heating effects?
Show us how many hours above 90 degrees each year from June - Sept, years 1960-2022. That will show a big trend- I assert.
ReplyDeleteIsaac.... as I mentioned in by blog. The number of days or hours abuot 90F are increasing...that makes sense with global waming. But little change is occurring in extreme temperatures...that is my point...cliff
DeleteThe main reason to take global warming seriously (and by that I mean the 1-2F increase, not individual extreme weather events) is that taking a large body like Earth and heating it up on average by 1-2F is inherently risky because if something goes catastrophically wrong there will be no time to reverse it. Its like I smoke a pack of cigarettes daily for 25 yrs. I might never get lung cancer but if I do, it is too late to do anything about it. We only have one Earth and erring on the side of caution is the rational thing to do. Now the left has politicized global warming to the extent that every hot day is used as a stick to beat conservatives with but that doesn't imply that conservatives who are on the other extreme are the solution either. The bitter political divide makes it hard to do the right thing (eg nuclear reactors which liberals are opposed to).
ReplyDeleteI agree totally with you that global-warming should be taken seriously. The time for positive, constructive change is *now*. The government should be informing us clearly and specifically the efforts to use technology to solve that problem.
DeleteI also agree completely with your analogy about cigarette-smoking. I completely disagree with the contradictory, proposed solution about nuclear-power. My opinion is that nuclear-power, while *probably* safe, seems to me about the same potential danger of getting lung-cancer from the first time ever that a person smokes a pack of cigarettes.
Nuclear-power is *probably* safe. But I think it is a bad idea to become dependent on it or to see it as a *solution*
Why?
Do we really want *those people* increasing the potential danger of a Fukushima or, less realistically a Chernobyl, in the USA?
Those same people are the reason - in my opinion - for the chaos a few months ago with the global supply chain chaos
*They* manage without regard for potential problems they didn't think of before they made us dependent on their product
Our society is most likely not designed to function well when it shuts downs.
Gruesome concept but after the Covid-19 pandemic and its continuing effects, we need to seriously consider what would happen - for example - if the country suddenly lost 30% of the population?
Are those supply-chain bean-counters even concerned with such - previously - unrealistic possibility?
Nuclear-power is *probably* safe but I don't have a lot of confidence in the management of crisis
Very well put. I despise how human intervention in the climate has been politicized. Makes it impossible to keep your eye on the prize.
Delete1/
DeleteSeems incredible to me that people actually agree global-warming is a problem. Or is it just a vocal minority of the population?
Hour to hour, for the past 50 years, nuclear-power has been safe, for one reason and one reason only: people
*People* make nuclear-power safe
And Fukushima showed us that the supposed safeguards are not reliable
How many other major natural-events have knocked down a nuclear-reactor complex? I can't think of any other than Fukushima in 2011. So nuclear-power is 0 for 1 in terms of promising a graceful transition when catastrophe occurs.
I'm sure their highly-paid lobbyists will crow day after day about contingency plans for a biological-catastrophe such as the (seems to me) inevitable strike of a slightly more dangerous version of Covid-19. But I think the danger is too great. When nuclear-power becomes unsafe then it really becomes unsafe and that stuff doesn't go away
The solution has to be from somewhere else.
An idiot proof solution.
One solution: convince the puerile population to make the slightest of sacrifices and cut back on power use. Plenty of sources on the internet with simple tips on cutting back on power usage.
There has never been a more wasteful society in the history of the world as that exists today.
The most effective solution is one that permits continued waste - because polluters will pay the utility companies for it - of capacity but that doesn't pollute with emissions or some other form of pollution.
THE PROBLEM is there is no rush to spend money on the high costs of researching alternatives that MUST BE superior to today's sources of capacity
SOME PEOPLE will line up to purchase electric-cars (I haven't owned an automobile in almost 20 years now) but I suspect the terminal appeal of the gasoline-combustion engine is in its ability to hop in the driver's seat and know you can immediately drive out of Seattle on I-90 and zip across state through here in Spokane and on to Montana, for instance, knowing there are about a million gas-stations between there and not having to worry about running out of battery-power
So any massively-popular alternative to the current automobile will have to be superior to what's available now.
And who's going to spend the money to develop that?
Well, no one. BECAUSE no one is demanding it.
2/
DeleteWe can sit around and debate the trivialities of summer-averages and trend-lines and 3+1=5 but none of it matters because about a gazillion tons of greenhouse gas got pumped into the atmosphere yesterday while no one did anything constructive about it.
The sad truth is that the USA cannot be the leader on this topic.
We have no real idea just how polluted is Russia but I suspect they are polluted already beyond comprehension. SO THEY certainly do not care about the environment. Here in Spokane in 1974 the USSR exhibition focused on the Soviet notion of "conquering nature".
To lead the world in solving the climate problem, the USA would have to lose it tenuous position in domination of global markets and truly, none of us here wants that to happen.
I traveled extensively in my youth outside this country. All it did was make me want to come back here to the USA.
Finally, thanks to Dr. Mass for this forum. I feel I better understand the topic because of the Cliff Mass Weather Blog. Me, personally, I don't even allow comments on my personal blog so I appreciate the source I can use to regularly find interesting information about a topic that is still important to me, a former amateur-triathlete always wondering if I would encounter rainfall on the Burke-Gilman trail in Seattle. Wondering if the polluted-lake-water or the poisonous car fumes I was gulping in was counter-productive to my cardiovascular training, not to mention the "coal rolling" savages that thought their pollution was more important than my personal-training.
The Great Heat Wave Dilemma was almost welcome to me when I lived in Seattle and trained for triathlon. I would get out to Coeur d'Alene and find the heat a lot more oppressive because I was training in the very mild climate around Lake Washington in Seattle.
Trend-line, summer-averages offer no solution to the problem. People don't care about a slight uptick on some graph similar to one they hated having to create in grade-school math class homework.
The people of the public *are not* academics. They don't care about theories and urbanization and variability.
They just want entertainment.
And that's all the mainstream-media is giving them with disaster stories.
Is not changing their behavior.
Is just entertaining them as they spew out more and more pollution.
So we can all rail against the evils of the mainstream-media but they're just doing what they need to do to get paid.
Nothing is going to change for the better unless change is actively researched and developed on a massive scale.
Kerry.... nuclear is the safest energy source we have. Even with the stupidity of Fukashima there were not deaths that I know of. France has massively used nuclear for decades...no problems there. And we have much safer fission designs today. Fusion will eventually be solved. You are right that alternatives have to be easy to use and reliable. Electric cars still have issues...like charging and where we get the electricity to charge them. But those will be solved eventually. I am pretty optmistic..cliff
DeleteCliff.... I won't take up more of your valuable time on this topic. If there's more I want to write on this topic then I'll use my own Twitter or blog
DeleteMy final comments are that my point is that "the safest energy source we have" is not good enough, in my opinion, for reasons I have described.
People want to complain about the minor-hardships of the Covid-19 debacle but they haven't seemed to learn anything from it. ANYONE making even the slightest attempt to understand my own posts about the subject should probably not be so optimistic
I don't know *why* I'm finding an ominous pattern and I don't know what it means but it certainly doesn't seem to be a reason for optimism, for me at least, for reasons I won't waste your time with here. I'll probably make a post on my blog in a couple days with a selection of my personal observations on the topic.
Fukushima may have had no direct causalities but that's no reason for optimism because it is still bleeding poison into the environment and will be for a very long time yet. Coal-plants might also spew out poison also - while in operation - but it's not ionizing radiation
What happens if a coal-plant is not shut down properly? It just burns itself out
The only reason Fukushima was not truly catastrophic is because people were around to minimize the catastrophe.
My point is that I am concerned we are living in a world of new conditions that makes nuclear fission power too dangerous in the long term
Fusion-power isn't ready yet and who knows when it will be ready
I'll publish again a selection of the rational, well-thought out reasons - based on my observations of people I have no control over - that explains why I am not so optimistic.
I care about this topic because I love nature and the beauty of our planet and our fascinating and dynamic climate and atmosphere. I hate seeing the beauty of our planet wasted by careless, unconcerned people.
So you're saying we shouldn't expect the extreme heat from last year but should expect longer strings of heat waves like we're having now?
ReplyDeleteThe 100+ days will only occur once a century?
yes...that is correct
DeleteThere actually is a trend in July, July-August, and June-August max temperature at SeaTac that is consistent with the average temperature increase. For example, here are the decadal average max temperatures at SeaTac for July-August (noting that Aug 2022 is missing):
ReplyDelete94.2 (2013-2022)
94.2 (2003-2012)
91.5 (1993-2002)
91.6 (1983-1992)
92.0 (1973-1982)
90.7 (1963-1972)
90.5 (1953-1962)
90.1 (1945-1952)
And here is for June-August:
96.5 (2013-2022)
94.4 (2003-2012)
92.3 (1993-2002)
92.3 (1983-1992)
92.6 (1973-1982)
92.0 (1963-1972)
91.4 (1953-1962)
90.1 (1945-1952)
This is the danger of eyeing trends without fitting a line. Max temperature is more variable than average temperature so it looks like a lesser trend, but it isn't. That said, one likely needs many more sites for a metric such as max temperature to be statistically significant given its variability. And something like 25 years of data plotted for Pasco Airport is obviously nowhere near enough to say anything about a global warming impact.
Adam...There is certainly a trend in average maximum temperature, which we would expect with GW. But there is very little trend in extreme high temps, such as the yearly extreme temperature....that is my point...cliff
DeleteUrban heat island effects from.airport sensors tend to make higher temperatures.
DeleteCliff, I disagree. The temperatures I posted are 10-year averages of the single day highest maximum temperature for July-August and June-August (i.e., the 1 highest temperature per year for those months), which are the exact same values that you plot in your time series, so your time series at SeaTac does in fact have an upward trend, and its magnitude is in fact completely consistent with the average temperature increase and GW, with the caveat of course that one should never rely on a single station for assigning GW as a cause.
DeleteAdam... try plotting the highest temperature in each decade at SEATAC. You will see what I am talking about. As an aside, there were more uber cool high years during the early part of the period (cold phase of pdo?) Anyway, consider the max highs per decade. 60s: 98, 70s 98, 80s:99, 90s:100, 00's 103, 2010's: 98.
Delete2010s were similar to the early part of the period. But we are considering just one location, which had a lot of observational issue (e.g., third runway, massive development around it). If you look at the number of records for all available stations, there is no upward trend. Check out this figure in one of my previous blogs:
https://1.bp.blogspot.com/-FIbdOkR5uoE/YN-q1x7NIVI/AAAAAAABCT4/PFBes_fjdvovlrYbD0fmKc7T0DVOVgSHACLcBGAsYHQ/s1692/Screen%2BShot%2B2021-06-30%2Bat%2B8.29.34%2BAM.png
Records temps and the extreme stuff is simply not going up as fast as the means or Tmax averages...cliff
Cliff, I get your point, and I recall that previous blogpost. I'm not arguing about the trend of all time record highs overall in the region inclusive of the 1930s where many records were set. I'm simply arguing that the time series plot you posted, which showed highest July-August temperatures each year (not each decade) does indeed have a trend. Decade highs at a single site give a very tiny sample size, which makes it unfair to compare statistically to something like average temperature. If sampling is the limiting factor, at best you can say that the trend is uncertain rather than there being no trend or an upward trend, which I'd guess is likely the case here. As an example of how easy it is to change the trend in max decadal temperature, you can add in June and 2020-2022. Then, if you do the highest June-August SeaTac temperature, you get this:
Delete2013-2022: 108
2003-2012: 103
1993-2002: 100
1983-1992: 99
1973-1982: 98
1963-1972: 98
1953-1962: 99
Voilà, a trend, all in the past 3 decades, but that is also consistent with the average temperature trend being relatively recent also. If your argument is that this is due to it being a single unrepresentative site that could be biased, then my argument is that it shouldn't be used as evidence of a trend or not then.
Now, I agree with the overall argument of natural weather variability dominating the delta over normal temperature whereas a shift in average temperature is by definition controlled by climate variability, whether global warming or natural oscillations. And trust me, attributing extremes to global warming by the media in a way that makes it seem like an extreme wouldn't happen and a day or period would be normal without global warming is very frustrating to me as well (though more frustrating is members of the science community that either prefer celebrity status over scientific objectivity or do not understand meteorology giving the perception of credibility and often seem personally offended by scientific debate). Leaving that frustrating and lengthy topic that you know all too well aside and focusing on actual science, what is the physical reason why a few degree increase in average temperature wouldn't also exist in extreme high temperature (like you've argued for heat waves before, i.e., global warming likely adds a few degrees on top of something that is already an extreme) apart from being a low sample size artifact?
Adam. I think we agree on several of the points. Regarding the decadal business...it is one station and a station in which the environment has radically changed. Not very good for climate studies. If you like at many regional stations, you find there is no trend in record temperatures And I can give you and example of how the extreme can be different in the mean. The great heat wave sin western WA are associated with strong easterly downslope flow. RCM simulations and physical reasoning suggest that easterly flow will weaken under GW as the interior preferentially warms compared to the coast...cliff
DeleteRight. I'm not questioning that extremes can be different from the mean. This can be caused simply from lesser sampling of extremes, which are thus less robust, though differences in measurement uncertainties, where averages are less affected, also enter in. I was simply pointing out that the trend for SeaTac over the last 50 years is similar in average and extreme high temperatures though extremes are understandably way more variable.
DeleteRecord highs going back to the 30s is a longer dataset. Do average temperatures have a similar trend where they were similarly higher in the 30s, i.e., are average temperatures setting more records than highs if you consider the longer data record that you are using to say there is no trend in record highs? I think it is important to be talking about the same dataset when comparing averages and extreme highs, whether that is length of record or which stations are considered.
Weakened easterly downslope flow counteracting greenhouse warming is an interesting point, and I know you have brought that up in previous blog posts, though does this rely on modeling different scenarios? I suspect the observational record of extreme events is too short given natural variability to prove one way or another what would be physically causing extremes to not go up as much.
Adam.... I am going to do another blog considering this issue...but using better stations than SeaTac, which is totally problematic because of the third runway, position changes, and major urbanization in the area. It is also valuable to use longer time series. There were major heat waves in the 1940s and earlier, which longer time series sample. The point is that trends can be influenced by the length of time series...and going back to the cold period of the early 50s has an impact. The weakened easterly flow is a very robust finding from multiple modeling studies. Also true in S. Cal. for Santa Anas. Regarding the Watts, Pielke, and Menne studies, there is a range of results here--and perhaps a deep review of the studies...on both side...might be an interesting blog. But I would find it very surprising if urbanization and instrument changes have not influenced the temperature records, and at least some studies have suggested it..cliff
DeleteUnfortunately this satire article is too true about how the press reacts:
ReplyDeletehttps://babylonbee.com/news/10-undeniable-proofs-climate-change-is-happening
i suggest to read the related calculations of tamino, which come to a strikingly different conclusion (tldr: trend is there, but short timespan makes it non-significant)
ReplyDeletehttps://tamino.wordpress.com/2022/07/31/not-even-wrong-2/
Dien.... Tamino is making some basic mistakes. I left a comment on his blog describing them. Tamino is not meteorologist or climatologist, but a climate activist--something worth noting when evaluating his blog..cliff
Delete