January 31, 2024

The Inner Secrets of An Impressive Pacific Storm

A very large, intense, and beautiful cyclone was off our shore yesterday afternoon (see below).  Stretching over several thousand miles, this cyclone was associated with active weather fronts, very strong winds, and powerful vertical motions.


But there is a lot with such storms that can surprise the uninitiated.   

For example, where are the strongest winds?  If you said in the very center of the storm, where the lowest pressure is observed, you would be wrong.  And there are many more surprises.  

Consider the winds.

Below is a short-term forecast map of sea level pressure and surface winds (below).  The solid lines are isobars (lines of constant sea level pressure) and you can see an impressive low center of 968 hPa.   That is quite low for this latitude.

But now look at the wind speeds (sustained not gusts) shown by the color shading.   The winds are actually quite weak in the center of the low, but very strong to the west and southwest (some winds over 55 knots).


But why there?   Why not where the pressure is lowest?   

Because winds are closely associated with pressure differences (horizontal pressure gradients) and those are greatest to the west and southwest of oceanic low centers.

Below is a blow-up of the sea level pressures at the same time.  Note the intense pressure differences to the southwest and west of the low center.  These pressure differences or pressure gradients drive the strong winds.  The pressure differences are weak in the center of the storm where the pressure is lowest.


I suspect I know your next question.  Why are the pressure differences largest to the southwest to west to northwest of the low center?  

Good question.  The answer has to do with temperature.  Look again at the figure above.  The color shading shows the temperature at around 800 meters above sea level (925 hPa pressure), with blue being the coldest and orange the warmest.  

The low center is drawing in cold air from the north and warm air from the south.  The greatest temperature contrasts are to the northwest and west of the low since this area has access to the primo cold air to the north.   

Temperature contrasts produce pressure contrasts since warm air is less dense (heavy) than cold air.

Finally, where do you think the heaviest precipitation is found in such an intense storm?  Near the lowest pressure?  

Nope.  Below are the predicted 3-h precipitation totals at the same time as the maps above.

Not much precipitation near the low center, but a LOT from the northeast to east to southeast.

Why?  Because that is where the strongest upward motion is found and upward motion is necessary to get precipitation.  This is where moist air is forced to rise by the air motions associated with the storm.  More on this in a future blog.


In summary, Pacific and midlatitude cyclones are very complex animals, ones we have only understood properly in recent years, mainly due to our ability to simulate their three-dimensional structures.


January 28, 2024

Water Vapor Fest over the Pacific Northwest

The U.S. West Coast is experiencing a very wet period and this pluvial bounty is not ending soon.

Dramatically, measures of water vapor approaching our coast are impressive.

To illustrate, consider the water vapor imagery from the NOAA GOES-West satellite on Saturday afternoon (see below).

I rarely show such imagery on this blog and it is virtually never presented by the media.  Where it is white, there is a lot of water vapor in the mid to upper troposphere (roughly 18,000 to 35,000 ft). The image below shows the entire West Coast engulfed in H2O.  

Expect little change this week.  Currents of water vapor, generally from the subtropics and tropics, are commonly called "atmospheric rivers" and several of them will be headed for the western U.S. this week.  

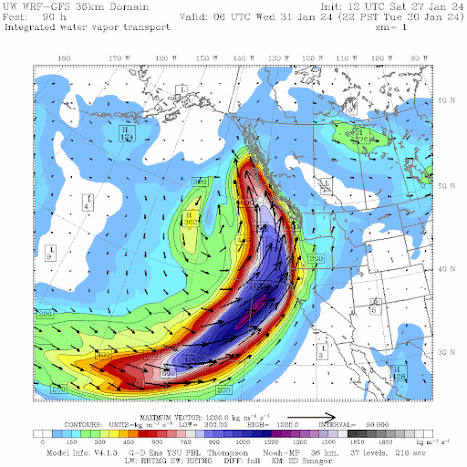
One of the best ways to identify a potent atmosphere river is to plot "water vapor transport", which is essentially the moisture (water vapor) content of the atmosphere times the associated wind speed.   Essentially a measure of how much water vapor is being moved about by the winds.

The predicted atmospheric river and associated water vapor transport this evening (Sunday) are impressive (blue colors), with the most potent influx of water into British Columbia.


But if you REALLY want to be impressed, check out the atmosphere river prediction for Tuesday evening.   Just wow.  And this one is headed for northern California and the Pacific Northwest.


The predicted 48-h precipitation totals ending Friday morning are impressive over northern California and British Columbia gets a big piece of it as well:


Many West Coast rivers will be running high.  In fact, they are already running high with numerous NW rivers much above normal on Saturday (see below).

Stay dry,


January 26, 2024

Water Resources Looks Good Over the Western U.S.

 The end of January -midway into the western U.S. water season--is a good time to evaluate potential water resources for the upcoming summer.

There had been some concern that an El Nino winter would result in drought conditions for some and flooding for others.  Fortunately, such fears do not appear to be realized.

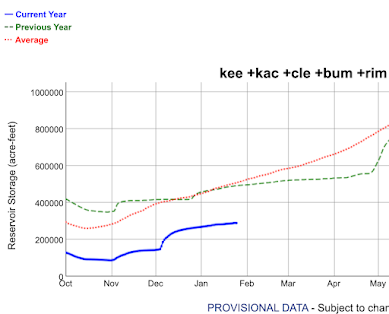
Let us begin by reviewing the all-important reservoir levels in California,  whose low values two years ago were a cause of great concern.

As shown below,  California's reservoir levels are in excellent shape and generally well above normal.  The largest and most important reservoirs (Shasta and Oroville) are at 121 and 131% of normal, respectively.  Other reservoirs are also in good shape.


Moving north, what about the water levels behind the all-important Grand Coulee Dam in Washington State?  As shown below, water leves are above normal.  Good for power generation and fish.


Seattle's reservoir levels? 
 

In December they had fallen substantially below normal, but four days ago (Jan 22, shown below) were just below normal.  Recent rains have brought reservoir levels up to nearly normal.  With the certainty of substantial rains during the next weeks and a near-normal snowpack for the relevant mountain drainages, Seattle should be in good shape waterwise for this summer.

What about the current snowpack in the Northwest?

Over Oregon (below), with the entire state averaging a bit over 100%.


Washington (below) is currently a bit below normal, with the critical Cascade watersheds around 80%-- a far better situation than a month ago. The Yakima drainage is at 91%.

The next week should be very wet along the West Coast.  First, the Pacific Northwest and British Columbia will be hit by a series of moderate atmospheric rivers (see the European Center total precipitation forecast through Monday afternoon below.)  


And then the atmospheric hose will move down into California, with the four-day total ending next Saturday being quite impressive from southern Oregon to Baja California.


In short, the water situation for most of the West Coast looks relatively favorable in general. 

But that is not to say that there are some areas we are watching carefully.   For example. the Yakima River storage is only about 60% of normal (see below).  But with the Yakima drainage snowpack at 91% and lots of precipitation coming, one can be optimistic that the situation will improve.

Yakima Reservoir Levels

Finally, with El Nino starting to weaken rapidly, its impacts should begin to fade during the upcoming months.


January 24, 2024

El Nino is Dying and the Northwest Will Get Drenched

All natural phenomena have their time and for our current strong El Nino, time is up.


Observations have shown the beginning of a rapid weakening of El Nino, a decline predicted by models for quite a while.   A decline so substantial that it will lead to a La Nina for next winter.

To tell this tale of decline, let's start by looking at the key index of tropical Pacific sea surface temperatures, the Nino3.4 index, the difference from normal of sea surface temperatures in the central tropical Pacific (see map below).


The plot of Nino 3.4 temperatures over time (below), shows a warming that peaked during
November/December at around 2C above normal, with a cooling starting in January.


But like most things, the signs of real change are hidden beneath the surface.  So let's look at the warmth of water beneath the surface of the Pacific Ocean (see below).   

Now we plainly see the future!  The warmth of the water beneath the surface is rapidly declining.  Over half the warmth is gone!

Consistent with such observations, the latest El Nino forecasts are predicting a rapid drop in the temperature in the Nino3.4 area, and thus a rapid attenuation of El Nino.  By mid-spring, El Nino will be history.  By next autumn, La Nino (colder than normal tropical water) will reign.

What are the implications of these changes?

For the next month, not much.   The tropical waters will still be warm, with the typical impacts on atmospheric circulation.    El Nino pushes the Northwest towards a warmer-than-normal situation, which is certainly what is predicted for the next week. California is normally wet under El Nino.

But El Nino is not destiny and the latest model forecast is for a very wet period over the West Coast from northern CA through BC for the next week (see forecast below).  Good news for filling regional reservoirs.  

I am getting increasingly optimistic about the Northwest regional water supply situation next summer.


January 22, 2024

One of the longest jet streams in memory

This week I gave a lecture to my junior weather analysis class on the jet stream, a current of strong winds in the upper troposphere (25,000 to 35,000 ft above sea level) in the midlatitudes.   So I have been musing about this topic a bit.

Yesterday I saw the current map of winds at 300 hPa (about 30,000 ft) for the entire Northern Hemisphere and was taken aback:  the longest continuous jet stream I can remember.

As shown by the map valid 1 PM Sunday, strong westerly winds exceeding 100 knots stretch from Iran to Baja, California.   Halfway around the entire Northern Hemisphere.  About 8000 miles.


Looking closer, the entrance to the jet stream is over Iran, passing over northern India and then China before heading out into the Pacific.


The jet stream crossed the Pacific and then plummeted southward over Baja (see below).

With such an extraordinary jet stream in existence, I wondered where the air that reached, say, San Diego was during the previous days.

To answer this question, I ran the NOAA Hysplit trajectory model, creating what is called "back trajectories" ending at various elevations above San Diego (see below). I traced the air back ten days.

Not unexpectedly, the air could be traced back over China and Iran over a week before!

Now considering the current world situation and past concerns about Chinese spy ballons, perhaps we should keep this as a little secret just between us.  😊

January 20, 2024

The Cold Weather is Over

After a record-break string of cold weather, with ice and snow extending to many low-elevation areas in the Northwest, some very welcome warmth is coming.

In western Washington. you can say goodbye to the teens and twenties and welcome temperatures climbing into the 50s.  Eastern Washington will thaw out.

And ample precipitation will return to the West Coast, helping to push off concerns about drought.

Winter is running out of time with ice/snow conditions over the lowlands becoming far less possible in roughly a month.

Strangely enough, if one averages over time, this winter has not been unusual, a fact that probably will not gain the interest of the media.    Looking at the temperatures at SeaTac (blue lines) versus the normal range (brown band),  we were cooler than normal in November, warmer than normal in December, and uber-bold in January.

Preciptiation?  Amazingly the total since October 1 (known as the water year) has been nearly exactly normal.  No drought.


Eastern Washington has a similar story, as shown by the precipitation in the Tri-Cities.


And now the part that will warm your heart and other body parts.

The predicted temperatures in Seattle for the next 12 days is for warmer than normal conditions, with many days getting into fifties.  You won't even see thirties.


The Tri-Cities into the mid-40s by the end of the period.


So what has happened?  

The key is that the influx of modified Arctic air from the interior of the continent ends, with the loss of cold air over the Columbia Basin and the interior of British Columbia.

You can see this for yourself.    The maps below show sea-level pressure, low level temperatures (at around 800 m, color shading, with purple and blue the coldest), and near surface winds.

At 10 PM yesterday, cold air was still in eastern Washington and  VERY cold air was entrenched east of the Rockies.  The coast wind are still offshore-directed.


But by 1 PM on Monday, the interior Northwest was warmed dramatically, with all the blue colors gone.


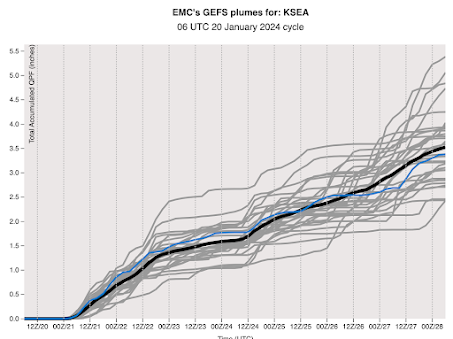
Now only will we warm, but normal precipitation will return.  The latest ensemble prediction of many forecast simulation from the NWS GEFS system shows Seattle receiving about 3.5 inches during the next ten days.


The UW model's cumulative precipitation forecast for the next ten days will bring a smile to local ducks and slugs, with substantial precipitation (reaching totals of 10 inches in the mountains), from central California to  British Columbia.  

Many of the fears for water problems from an El Nino winter will not be realized, which is good news.


January 18, 2024

Freezing Rain or Rain That Freezes? They are NOT the Same!

On Tuesday there was a lot of talk about freezing rain events, ice storms, and the like.   There was also a lot of confusion and misinformation about what happened Tuesday evening as precipitation moved in.

As I will describe, there was a lot of above-freezing rain falling on cold surfaces, but very little freezing rain.  Few locations experienced freezing rain, but some locations had rain that froze on localized cold surfaces.


So what exactly is freezing rain?

Here is the definition provided by the National Weather Service:

Freezing rain occurs when snowflakes descend into a warmer layer of air and melt completely. When these liquid water drops fall through another thin layer of freezing air just above the surface, they don't have enough time to refreeze before reaching the ground. Because they are “supercooled,” they instantly refreeze upon contact with anything that is at or below freezing (32 degrees F), creating a glaze of ice on the ground, trees, power lines, or other objects.

The Wiki definition is pretty much the same:


The figure below illustrates a freezing rain situation (from NOAA). 

Aloft, where the air is below freezing, all precipitation is in the form of snow.  Certainly true this week.   

Then the snow falls into a layer above freezing and the snow melts into raindrops. The water in these raindrops is above freezing.

Then the raindrops fall into a modestly deep BELOW FREEZING layer and raindrops cool below freezing (32F, 0C) but remain as water.

Yes, believe it or not, liquid water can cool below freezing and stay liquid.  This is called supercooled water.

Supercooled water has been described as "liquid dynamite" because if it hits a surface below freezing, it freezes on contact.  Instant and profound icing that can be very dangerous.

Freezing rain can accumulate on trees, causing branch failures and power outages.  It can fall on subfreezing roads causing near-instant glazing, resulting in accidents.


And it can cover aircraft with ice, halting operations.

This is NOT what happened on Tuesday evening over Puget Sound country.  Very little freezing rain occurred.  Very little impact occurred.

I can prove that this was not a freezing rain event by showing you the temperatures above SeaTac Airport on Tuesday.  The figure below presents winds and temperatures at the airport based on sensors on incoming and outgoing aircraft.

At 7 PM, the freezing level was ABOVE 5000 ft.  Temperatures were above freezing all the way to the surface.   A narrow band of precipitation was just reaching Seattle at this time (shown by radar image below).

 The snow aloft fell into the warm air below and rapidly melted (it takes about 1000 ft to melt snow into rain).


7 PM weather radar

By 10 PM, the precipitation band was over Puget Sound (and would be through by about 1 AM)--see below.  Temperatures were still above freezing through much of the lower atmosphere, except for a narrow layer where evaporation of falling rain cooled the air to near freezing.  The surface air temperature at SeaTac at 10 PM was 31F.   

10 PM radar

However, such a shallow layer of near-freezing air did not warm the rain by much and it hit the ground above freezing (I measured the temperature of the rain at my house that night and it was roughly 35F).

Thus, this was not a freezing rain event.  

Freezing rain sensors at both Olympia and Boeing Field did not report freezing rain at any time.   At SeaTea (which is relatively high at 452 ft) it reported light freezing rain for one hour only (which may be a sensor issue).

Unlike true freezing events, there were few reports of accidents, roadway closures, falling trees, or power outages.

But some folks reported localized icing.  What happened if this was not freezing rain?

Answer:  It was rain, relatively warm rain, the froze eventually in some locations where the surface was below freezing.

We had just finished one of the coldest periods during the last 30 years in our region  Looking at 3-day stretches, the period ending January 14th had the coolest average high temperatures (26F) in the period.  Many surfaces were cooled down.


But now it gets complicated, December was relatively warm and the soils below the surface were above freezing.  For roads in contact with warm soil, many were above freezing on Tuesday evening, with the above-freezing air temperatures that day helping to prevent freezing surface conditions.   With relatively warm rain, there was no ice.

Thus, most/roads were fine.   But in places that were particularly cold (e.g., shaded locations) and where there was not good conduction of heat from below, the previous cold spell left a vulnerability to icing.

In short, this was not a freezing rain event where supercooled water freezes instantly on cold surfaces, but a situation with warm rain freezing on some chilled surfaces.   

A subtle distinction perhaps, but an important one.


January 16, 2024

Heavy Lowland Snow over Northwest Washington Tomorrow

Snow is coming back to the Washington lowlands.   

Northwest Washington, from Bellingham to the San Juan Islands to the northern Olympic Peninsula, will experience a significant snowfall.

The Puget Sound lowlands will experience some flakes, and maybe even some limited freezing rain, but it won't amount to much.

I waited to talk about this until I had confidence in the forecast.   

Let me start by showing you the total snowfall (amount of snow falling from the sky) from the latest high-resolution UW forecast.  Snow depth would be less.

The precipitation will reach us around dinner time today, but temperatures will be too warm for snow over most of the lowlands.  Here are the predicted snow totals through 10 PM tonight.  Light amounts over the Olympics and the southern Cascades.


But gird yourself for a shock.   Snow totals through 11 AM Wednesday are stunning.  Significant snow over southern BC and northwest Washington.  Bellingham and the San Juans will have several (up to a half foot) inches.  Port Angeles is the same.  Nice snowfall over the Cascades and ALL of eastern Washington.


And it doesn't stop.   The Cascades end up with 1-2 feet by 7 PM Wednesday.  Keep that in mind if you are planning cross-Cascade travel.   Whatcom County could get around 8 inches.  Southern Vancouver Island, including Victoria, will be hit hard.

The MUCH lower-resolution European Center model is similar, so there is some confidence in this prediction (see below).


So what is going on?     

This is an event in two acts.

In the first act, an occluded front associated with a low-pressure system offshore will move through our region.  The satellite image (from around noon) shows the story.


The issue is that the atmosphere has warmed up considerably during the past day and is now too warm for significant snow over the lowlands.  We know this because we get temperature information from aircraft coming in and out of SeaTac (see plot at 1 PM today below).  

It is above freezing near the surface and aloft (above approximately 1600 ft), with a shallow below-freezing zone in between.  There could be a few flakes getting to near sea level and perhaps a spot of freezing rain, but nothing of note.


But something special will happen tomorrow that will doom Northwest Washington!  

The low center will move into western Washington (see surface map at 7 AM Wednesday) and this will pull cold air (blue in the figure) into NW Washington, particularly through the Fraser River Valley northeast of Bellingham.


The UW WRF model explicitly forecasts this cold flow as shown by the surface wind prediction at the same time (7AM Wednesday).  

This northeasterly flow is quite cold enough to snow and thus Bellingham, the San Juans, Victoria, and the northwest Olympic Peninsula will get several inches.


There may be a few flakes over Puget Sound, but nothing significant.

Finally, in my previous blog, I noted that wind and solar were essentially zero for the Northwest in this situation.  Well, the situation is still very bad (near zero generation) for wind and solar (green line).  Hydro is doing most of the heavy lifting, with nuclear being a very valuable number two.   

 We need both hydro and nuclear and this situation will not change quickly.

This is reality.

red is total electrical demain, blue is hydro generation, green is wind and solar, purple is nuclear.


Another Northwest Bomb Cyclone with Localized Strong Winds

  Don't tell the media folks, but another midlatitude cyclone will be "bombing" off our coast today, with some local impacts. ...