A very large, intense, and beautiful cyclone was off our shore yesterday afternoon (see below). Stretching over several thousand miles, this cyclone was associated with active weather fronts, very strong winds, and powerful vertical motions.
.gif)
For example, where are the strongest winds? If you said in the very center of the storm, where the lowest pressure is observed, you would be wrong. And there are many more surprises.
Consider the winds.
Below is a short-term forecast map of sea level pressure and surface winds (below). The solid lines are isobars (lines of constant sea level pressure) and you can see an impressive low center of 968 hPa. That is quite low for this latitude.
But now look at the wind speeds (sustained not gusts) shown by the color shading. The winds are actually quite weak in the center of the low, but very strong to the west and southwest (some winds over 55 knots).

But why there? Why not where the pressure is lowest?
Because winds are closely associated with pressure differences (horizontal pressure gradients) and those are greatest to the west and southwest of oceanic low centers.
Below is a blow-up of the sea level pressures at the same time. Note the intense pressure differences to the southwest and west of the low center. These pressure differences or pressure gradients drive the strong winds. The pressure differences are weak in the center of the storm where the pressure is lowest.

I suspect I know your next question. Why are the pressure differences largest to the southwest to west to northwest of the low center?
Good question. The answer has to do with temperature. Look again at the figure above. The color shading shows the temperature at around 800 meters above sea level (925 hPa pressure), with blue being the coldest and orange the warmest.
The low center is drawing in cold air from the north and warm air from the south. The greatest temperature contrasts are to the northwest and west of the low since this area has access to the primo cold air to the north.
Temperature contrasts produce pressure contrasts since warm air is less dense (heavy) than cold air.
Finally, where do you think the heaviest precipitation is found in such an intense storm? Near the lowest pressure?
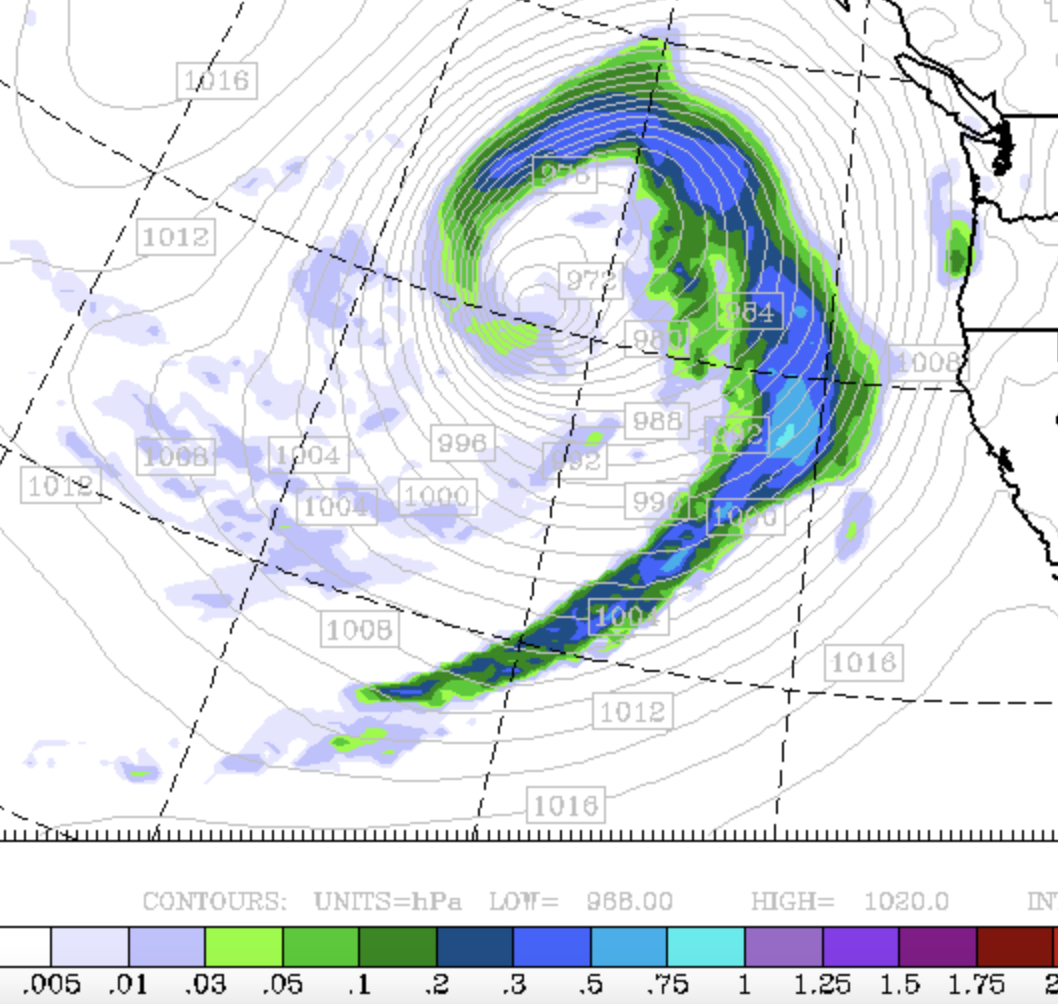
Nope. Below are the predicted 3-h precipitation totals at the same time as the maps above.
Not much precipitation near the low center, but a LOT from the northeast to east to southeast.
Why? Because that is where the strongest upward motion is found and upward motion is necessary to get precipitation. This is where moist air is forced to rise by the air motions associated with the storm. More on this in a future blog.
In summary, Pacific and midlatitude cyclones are very complex animals, ones we have only understood properly in recent years, mainly due to our ability to simulate their three-dimensional structures.


Thanks for a very informative post, Cliff. Bravo - one of your best!
ReplyDelete(Also helps me understand why (colder) NW'ly winds are so strong with frontal passages.)
"In summary, Pacific and midlatitude cyclones are very complex animals, ones we have only understood properly in recent years, mainly due to our ability to simulate their three-dimensional structures."
ReplyDeleteInteresting, an honest admission of phenomena that scientific inquiry as of yet doesn't fully understand. Yet we have an overabundance of "experts" telling us in no uncertain terms of our impending climactic doom if don't drastically lower our standards of living ASAP.
Weather ≠ Climate
DeleteEric, that's how science works, the same as weather models. You draw predictions based on the best fit consensus, take into consideration the uncertainty, and take calculated action based on the current results. Adjust as time goes on. The key part of Climate change theory and what to do or not do is high inertia and the window of opportunity for options to correct or mitigate logarithmicly decreases as time passes.
DeleteHuman inertia against corrective action is incredibly high due to the current world economic realities and political instabilities. (your statement is part of that inertia)
Risk management perspective: making collective decisions to reduce CO2 and methane emissions comes with some sacrifice, but also opportunity to rethink how we live and future technology.
Not making any changes and riding the intertia, if the theory continues to prove valid, basically will have less options and greater suffering in the long run.
If you care about others besides yourself, now and future generations, I think the first option makes a lot of sense. And it has benefits even if climate change is less extreme then predicted. However, things like accelerating glacial recession over the last 100 years is hard to deny attribution to the industrial era.
OK, Glaciersaredisappearingwe'reallgonnadie, I'm going to take you at your word in terms of how much you care about others beside yourself. If you want anyone else to believe you, then you must do the following ASAP:
Delete- give up your gas stove;
- give up your gas furnace;
- give up your gas powered auto and/or truck;
-any power you use for your home and/or vehicle must be electric, and must not be supplied by any other forms other than wind or solar (since damns are now deemed bad);
- pledge not to use any air travel over the next ten years;
- live in a multi - unit building, and your living space is 800 square feet or less;
- give up any pets you currently have;
- promise not to procreate.
All of these edicts have been seriously proposed by others espousing exactly your viewpoints illustrated above. If you can honestly enact all of these programs and stick to them over the course of the next few years (with verified evidence), then perhaps the rest of us will take you more seriously. If not, then you'll just be another virtue - singling poseur.
"some sacrifice, but also opportunity to rethink how we live and future technology"
DeleteWhy does this always end up meaning "forced to accept weird unrelated lifestyle fads that greens want to push"?
Your analyses of weather features, big and small, off our shores, are a super education.
ReplyDeleteCliff - Do you have an opinion on why the recent Atmospheric River forecast for our area was basically 100% wrong? We have gotten hardly a drop of rain since Sunday.
ReplyDeleteA very interesting fog phenonium in BC's Okanagan: https://www.cbc.ca/news/canada/british-columbia/pink-purple-fog-kelowna-penticton-1.7100456
ReplyDeleteGreat post! Always more to learn.
ReplyDeleteWe live 3 miles north east of Arlington Washington, basically at the mouth of the gap in the mountains as you head up towards Darrington. The north east winds were easily 50 to 55mph as that low pressure was at its strongest and as the warm front was still south of the area, very localized event and happens quite often up here and only affects a small area
ReplyDeleteThe recent anomalous weather brought the warmest January temperatures seen in Whatcom County in more than a century. The "Clearbrook" NWS COOP weather station, situated about midway between Lynden and Sumas, recorded a temperature of 66F on 1/30 - the highest January temperature since records began on 3/1/1903.
ReplyDelete