Meteorologists need the help of Big Tech to improve weather prediction and save lives.
How? By collecting pressures from smartphones.
This blog asks for their assistance.
There is no more useful weather observation than surface pressure. With surface pressure alone, one can determine the three-dimensional structure of the atmosphere, sense the precursors of severe thunderstorms, and much much more.
Many smartphones include excellent pressure sensors, mainly to help determine elevation.
With billions of smartphones with pressure sensors around the world, there exists the potential to greatly improve weather forecasts, particularly in third-world countries with sparse weather observations and for severe thunderstorms in the U.S.

There are research groups, including my own, that have solved the technical issues of calibrating smartphone pressures using machine learning and making the observations anonymous.
But there is a major problem: collecting the pressures from smartphones. To solve the problem, we need the help of the tech
community: Apple, Google, Amazon, Samsung, Facebook, Twitter, Instagram, Microsoft, or others.
Help that could revolutionize weather prediction and save many lives.
The Demonstrated Potential of Smartphones to Greatly Improve Weather Prediction
Below is a sample of the distribution of smartphone pressures at a single hour in 2018. There is an extraordinary density of observations in the eastern half of the US, but plenty in the West. Keep in mind that this sample is from a single app reporting from perhaps one out of a thousand smartphones.

To show the value of smartphones, consider the landfall of Hurricane Michael on the Gulf Coast on October 10, 2018 (see below). The top right panel shows the normal data collection (each dot is pressure observation, color-coded by pressure--red is high, green/blue is low. With power outages, many traditional observing locations were offline, but the smartphone observations were numerous and clearly showed the location of the eye.

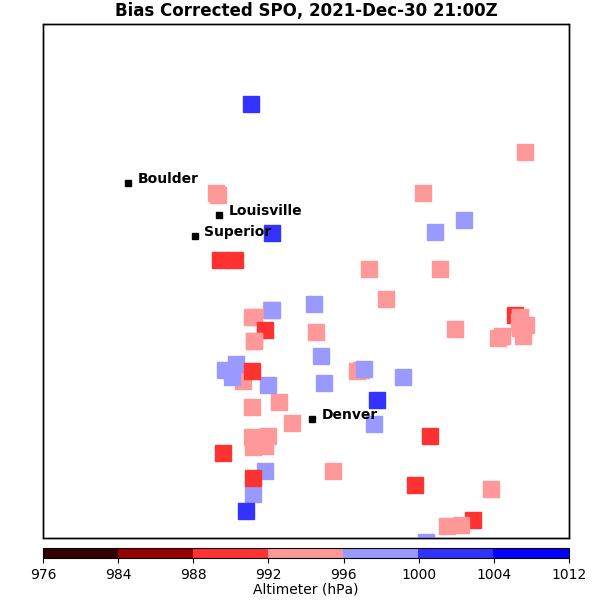
For the recent, devastating Marshall Fire near Boulder, Colorado, smartphone pressures defined the low-pressure features that drove the strong winds (dark red colors on the map below)--something the traditional weather network missed.
I could show you many more examples like this, such as for strong thunderstorms, where the smartphone pressures delineate critical details.
I can also show you forecasts in which the use of smartphone pressures improved the forecast. To provide a local example, the figure below shows you a radar image (left panel) indicating a Puget Sound Convergence Zone (inside the red circle), a frequent weather feature of western Washington. To the right are two forecasts, one using smartphone pressures and the other without. Without the smartphone observation, the forecast system does not predict a convergence zone (middle panel), but with regional smartphone observations, it does!

Second, since folks are rightfully concerned about privacy, we had to anonymize the pressure observations. We did this by adding random noise to the location and collecting the pressures in small boxes with several observations. Even with our steps to ensure privacy, the smartphone pressures (smart-anon in the figure below) had less error than the current National Weather observations (MADIS). An extraordinary achievement of Dr. McNicholas!

Helping the Second and Third World
We can prove that even the moderate smartphone pressure density provided by IBM/WeatherChannel can help improve our analysis of surface pressure and enhance forecasts over the relatively data-rich U.S. But the real quantum leap may be over the second and third world where this are many smartphone users but poor meteorological observation networks. The map of surface observations used by the European Center for Medium-Range Weather Forecasting for December 2020 is shown below. LOTS of observations over Europe, but major holes over Africa and South America.

Why We Need Big Tech's Help
We should be able to greatly improve weather prediction if meteorologists can secure a lot more pressure data from smartphones
And only big tech can provide this data. Only they have apps on many phones or control the operating system on the phones.
For example, Google, which controls the Android operating system and major apps--like google maps, could solve the problem.
Can anyone in Google help? Or contact someone that can help in Google?
Apple, which controls the iPhone operating system and many apps, could make it happen.
Facebook or Twitter, with huge numbers of folks using their apps on smartphones, could supply the data.
Amazon has apps that are on many smartphones.
You get the picture. We can greatly improve weather forecasting,
but the assistance of one or several of the major tech firms is needed.
Are there any readers of this blog that can help?
If so, give me a call, email, or leave a comment.


What happened to uWx pressure-nexus? Is it still active?
ReplyDeleteKarl...no...that is done. But extremely valuable learning exercise and initial dataset..cliff
Deletethat app was a real pleasure to use, with a good interface.
Deleteare there any other such apps out there currently, Cliff ?
Glad to see you are still pursuing this program. We are a strong supporter of cell phone barometers and have provided a way for users to accurately calibrate their phone barometers online at https://starpath.com/barometers. We also have full range (800 to 1060 mb) calibration equipment here with two NIST standards and have calibrated many phone barometers. Generally out of the box they are within ± 1.5 mb and it is easy to trim that down to reliably below 1 mb. One issue to get around with the iOS versions (iphone 6 or newer has a barometer) is that location services must be on to access the baro sensor and that is a big battery drain. Also it seems that having a way to submit the pressure when the user is standing on the ground would be valuable in that it is easy to get the elevation of the ground from the Lat-Lon but there is no easy way to know if they are up off the ground in a building.
ReplyDeleteI've got a no longer used cellphone sitting on the table right next to the base station for my Davis Vantage Pro 2. It has the Pressure Net App installed and has been uploading barometer readings once a minute for the last several years. Thanks to Dr. Mass for clueing me in to that app on this blog.
ReplyDeleteIt would likely be pretty easy for others having a situation similar to me to do the same thing. Repurposing a perfectly functional electronic device and continuing my citizen scientist efforts is a win for everyone.