Ski areas are opening and expanding operations throughout the region for a good reason: the past week has brought large additions to the mountain snowpack....and models are suggesting much more is coming during the next ten days.
The mountain snow situation this fall has been a roller coaster ride, with huge snow dumps followed by warm atmospheric rivers that took most of it away. Fortunately, the snow roller coaster ride is over, with substantial gains during the next month.

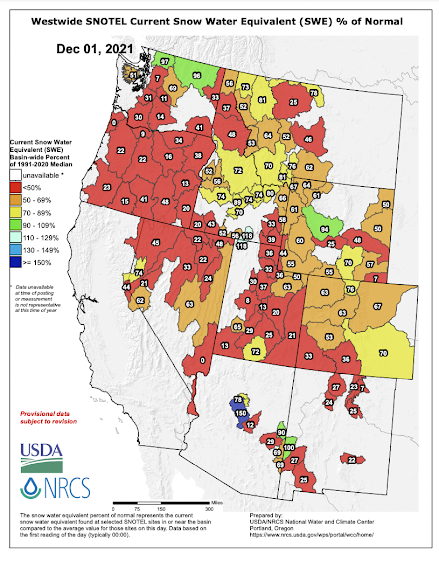
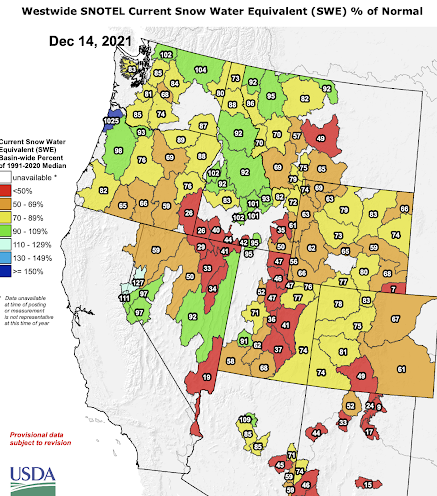
To see how much better things have gotten, compare the USDA SNOTEL percent of normal snow water (SWE) on December 1st and this morning (see below).
On December 1, after multiple warm atmospheric river events, the entire Northwest was below normal with ALL of Oregon and half of Washington possessing less than 50% of the normal snowpack. Forget Thanksgiving skiing this year!
On December 1, after multiple warm atmospheric river events, the entire Northwest was below normal with ALL of Oregon and half of Washington possessing less than 50% of the normal snowpack. Forget Thanksgiving skiing this year!
But what a difference two weeks made. This morning the red (below 50%) areas are almost gone, with several areas near normal (green) in northern Washington, northern Idaho, and importantly in the central Sierra Nevada range. HUGE improvement.
What Happens Now?
During the next 48h, most of the snow action will be south of Seattle, as a Pacific low-pressure system moves southeastward off the Pacific coast, making landfall over central Oregon (see surface weather map at 10 PM Wednesday). This forecast map below shows sea level pressure (solid lines) and low-level temperatures, with blue and purple colors indicating cold air. Very cold east of the Rockies.
The snow accumulation through 4 PM Thursday reflects this low-pressure track, with the Oregon Cascades and northern California enjoying 1 to 2 feet of additional snowfall. This is excellent for water resources to our south.
On Saturday, a weak front will move through our region(see surface map of sea level pressure and temperature at 4 AM Saturday), which will move the precipitation north again.
The 48h snowfall total ending 4 PM Saturday shows the shift northward, with substantial amounts in the North Cascades and southwestern BC. Our snowpack will be solidly near normal for the entire region by this time.
The Seattle Times had a headline about lowland snow in Seattle...but that is not going to happen this week. I guess they are trying to sell more newspapers with that headline.

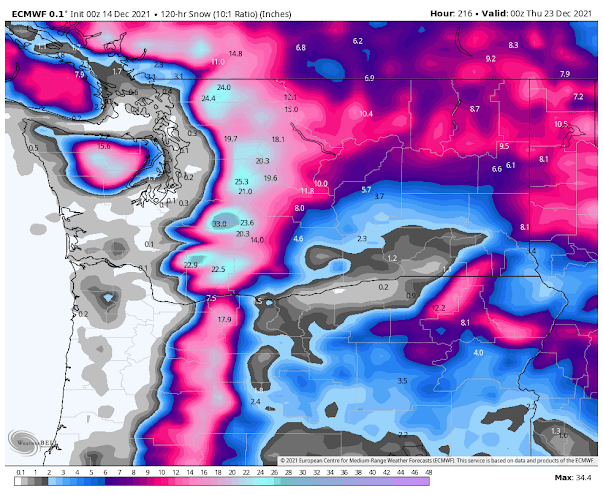
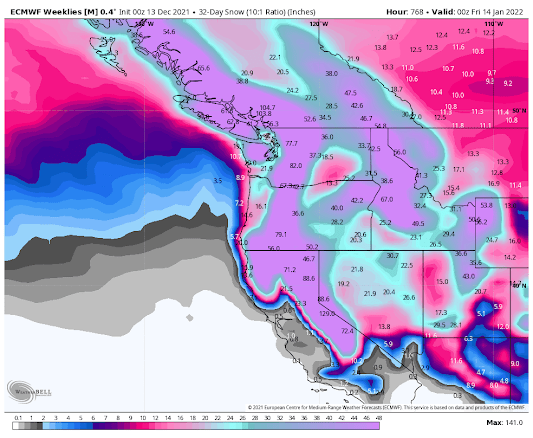
The subsequent five-day period brings even more snow in the mountains (see the forecast by the European Center Model below), with up to approximately two more feet above 4000 ft.
What about the European Center one-month forecasts? You better take a deep breath before you view this.
For the next month (through January 14th), the EC extended model is going for much colder than normal conditions over the entire West Coast (see below)
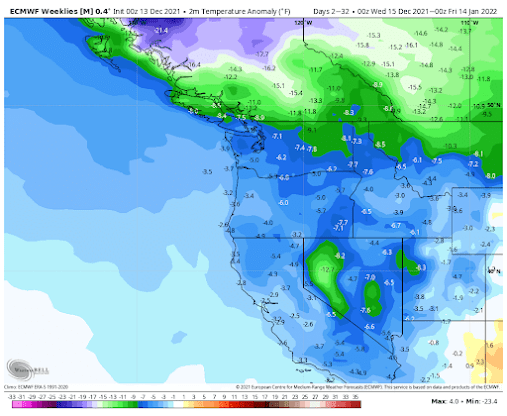
And snow will be bountiful over the entire region (6-10 feet)
And don't forget we are in a moderate La Nina, with the rest of the winter weighted towards cold/wet conditions.


Cliff, are there any indications of a artic outbreak headed our way?.
ReplyDeleteWill this snow and cold come with any sun?
ReplyDeleteCliff, is there any way we could get a bit more clarity on this: "And snow will be bountiful over the entire region (6-10 feet)".
ReplyDeleteCan you put some parameters on that?
4+ day window of anticipated arrival?
Anticipated length of event?
When temps drop, and to what levels?
Geographic parameters / elevations of event anticipated?
RE: your remark about the Seattle Times. HL Mencken famously said that the newspaper business was nothing more than buying newsprint at 5 cents a pound and selling it at 10 cents a pound. Still true methinks.
ReplyDeleteI love Mencken, particularly his quote of "Democracy is the theory that the common people know what they want, and deserve to get it good and hard."
DeleteI was heavily involved in automating SNOTEL data collection in the 2nd half of the 70's. We installed data collection and communication equipment in all of the participating states. California did their own snow pack data collect and reporting and did not participate in SNOTEL. Thus, the USDA/NRCS reports you show are blank for California. I would think that at some point in the last half century, California data would be integrated into these federal reports to provide a more complete view of the western snow pack.
ReplyDeleteDon't worry about the MSM, they'll just pivot immediately away towards claiming that the snow bounty as just another valid data point for AGW. Because Science!
ReplyDeleteOK, please tell me I am seeing the last image wrong. Twenty-one inches of snow for the 1-5 corridor in the next 32 days?!?! I will make the assumption that the model used to make this image does not mean to go down to sea level, but just the elevations above 1,000 feet (fingers crossed on that any way). If not, I guess I will need to stock up on my emergency supplies of pop tarts.
ReplyDeleteI'm guessing it's just a coarse grid model and that doesn't work so well in an area like the PNW where you can have radically different precipitation just a few miles apart. I wouldn't read too much into it as far as the potential for lowland snow.
DeleteLong term forecasts have a huge amount of uncertainty. Snow is particularly difficult to forecast for the west coast lowlands, because our winter weather is typically either cold or wet, but it's a minority of the time that it is both at the same time.
DeleteWhen we do get snow, usually either the temperature or the moisture content are marginal. A forecast even less than a week away for heavy snow can turn out to just be rain if the temperatures turn out to be only a couple degrees warmer than forecast, or clear skies if a humid air mass moves further north or south than expected.
So treat this forecast as indicating it is more likely than not that we'll have a decent amount of lowland snow, but with a lot of uncertainty. I'd say with the temperature forecast, it's very unlikely this will be one of the occasional no snow years, but the actual snow amount could very easily fall well short of what is indicated in the 1 month forecast. On the other hand, it could exceed that. In 1950, for example, the winter total snowfall for Seattle was just over 5 feet! (not all at once, of course).
You can usually start to get excited when you see snow in the 7 day forecast, with progressively more confidence the shorter the time you're looking ahead.
Yeah that can't possibly be right. 2 to 3 ft of snow in lower puget sound area (according to the image he shared) within the next month?
DeleteOr am I reading the image wrong?
The extended models are lower resolution, which smears out the terrain....which then extends over the lowlands. So you should not take the predictions over the lowlands literally...cliff
DeleteOK, thank you. I will hold off stocking up on pop tarts for now. I'll wait for the 5 to 7 day forecast.
DeleteThe snow forecast image says 10:1 ratio. Is that sizing, or measurements? (I.e. the 21.9 means 2.19 inches of snow?)
ReplyDeleteNo it means literally 21.9 inches of snow. The 10:1 ratio refers to the snow-water equivalent being used for the forecast. So 21.9 inches of snow equals 2.19 inches of liquid water.
DeleteThanks! Scary thought for I5 to get 22 inches, even if it is over 30 days and total snowfall (not accumulation)
Delete