January 31, 2016

Stop the El Nino Forecast Complaints!

I have been bombarded by complains from folks regarding the El Nino forecasts.

Wasn't El Nino going to bring dry weather?   Less snow in the mountains?

Complain after complaint.

But the truth is that the forecasts have actually been really quite good, with a lot of the misunderstanding coming from media folks that have not gotten the story quite right.

As they say in sports....let's go to the video tape.


Last summer, meteorologists were sure that a strong El Nino was going to occur this winter.  And we knew what this typically for NW weather:

Before January first there is no real correlation with precipitation or temperature.
After January 1, the Northwest tends to be warmer than normal, with precipitation SLIGHTLY below normal, little snowfall near sea level, and modestly below normal snow in the mountains, resulting in the snowpack on April 1 ending up around 80% of normal.  There is also a tendency after January 1 to have a trough over the northeast Pacific, with California ending up wetter than normal.  We also forecast that El Nino would kill the BLOB.

Don't believe me?  Check my blogs on
Sept 2Dec. 28...and many others.  Nick Bond, WA State Climatologist, was saying the same thing, as were many other local meteorologists.

Believe it or not....reality has followed these predictions quite closely.

The BLOB is dead, as shown by the latest sea surface temperature analysis, with modestly warm water immediately off the coast (typical of El Nino) and cooler than normal water offshore (blue colors).  Good forecast.

At the end of December WA snowpack was huge...about 150% in places.   Now, things have relaxed back to near normal in the Northwest, while California is above normal (see below).  Snowpack percentiles have dropped substantially in the Cascades.  The forecast is right on track.


Folks have been complaining about all the rain around here, lately, BUT IT ALWAYS RAINS A LOT IN JANUARY in our area.  Here is the precipitation departure from normal for the last 30 days.  Slightly drier than normal on the western slopes  the Cascades, but considerable wetter than normal over northern CA.  Good forecast.
 
Temperatures?   Warmer than normal over western WA and Oregon.  As predicted (although eastern Montana and North Dakota are cooler than normal, and usually El Nino brings warmth then).   Not perfect overall, but good over the Northwest!

Snowfall over the lowlands?  Much lower than normal...just a dusting one day here in Seattle.   Excellent forecast.  

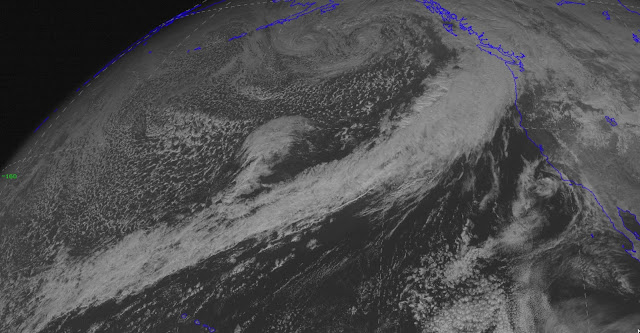
What about the flow pattern over the eastern Pacific and western North America?  Here is the anomaly (difference from normal) at 500 hPa (upper level around 18K feet) for the past month. CLASSIC EL NINO circulation, with a negative anomaly (low heights or  pressure, purple color) over the eastern Pacific. Truly excellent prediction.

One could quibble about details, but PLEASE give meteorologists some credit...we got this one basically correct.

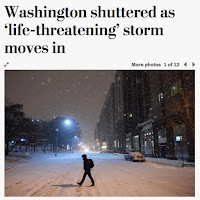
A hell of a lot better than political pundits and the Presidential election!

El Nino is not the end of the world in our area.    And a typical El Nino year is way better than the crazy ridge pattern of last year, a pattern that we believe is the result of natural variability.

__________
Please support KPLU's fund drive to allow it to survive. The link.  On Friday, they reached a major milestone:  one million dollars.  But they need to raise seven million to avoid destruction.   A good segment on the race to save KPLU was broadcast on Friday, found here.


January 29, 2016

The Finest Hours Storm of February 17, 1952


A weather-related movie opened today, one I saw earlier this week at a studio preview: the Finest Hours, the story of an extraordinary rescue of the crew of a tanker that split in two off the coast of Cape Cod on February 17-18, 1952 during a very powerful nor'easter.

In this movie, Coast Guardsman Bernard Webber and three volunteers headed offshore near Chatham, Massachusetts in a 36-foot wooden motorized lifeboat in 60-foot seas and 70-knot winds, rescuing 32 crewmen from the stricken tank vessel Pendleton.

This was a very strong storm, noted for heavy snowfall offshore and destruction of not one, but TWO, World War II era ships in the offshore waters.  As a meteorologist, I was curious about this powerful cyclone and tried to find some weather information.   Let me show you what I found.

Turning to the NOAA/NWS historical surface map website, I first found the surface chart for 7 AM Sunday, Feb. 17th (see below).    This map shows the fronts, sea level pressure, and areas of precipitation (shaded).  You will note a weak low along the Delaware coast, with a central pressure of around 1004 hPa.

One day later, the storm had exploded, deepening in to an intense midlatitude cyclone with the central pressure dropping to around 977 hPa (below is a general and close-up view).  That is 27 hPa in 24 hr, which means this storm can be classified as an explosive deepener or bomb.    Explosive deepeners are defined as storms that intense more than 24 hPa in a day.  The low at this time is just south of Cape Cod, with heavy snow and strong winds over coastal Massachusetts. 12-30 inches of snow accumulated with 43 weather-related deaths.


At the Boston Airport (some distance from the strongest winds), sustained winds hit 50 mph and the gusts would have hit 60-70 mph.   Worse over the water.  Pressure dropped to 989 hPa at Boston, with temperatures in the lower 30s,

Snow was intense NE of the low center;  as shown below, Portland Maine had it 4th worst snow event in the entire observational record:

1) 31.9" Feb. 8-9, 2013
2) 27.1" Jan. 17-18, 1979
3) 25.3" Feb. 17-18, 1952
4) 23.8" Jan 26-28, 2015

The upper level flow pattern (500 hPa, around 18,000 ft) showed a sharp trough over the eastern US on Sunday AM:
The upper trough rapidly deepened into an amazingly intense upper level low over the next 24 h.

There was no weather satellites or operational weather radars during that period....sorry.

The Feb 1952 was a powerful storm and certainly in the top 50 for nor'easter events.  But it was't in the first tier and certainly far weaker than Sandy or other mega-events.

Movie Comments:   A B picture which starts VERY slowly with a boring relationship angle.  Not much talk about meteorology.   A shame really.

January 27, 2016

Heat Wave over Western Washington

Temperatures in much of the region got into the upper 50s today, with several above 60F.  Here are some of the warmer temperatures as of 2 PM.


Why such warmth?   Strong  and warm southwesterly flow has moved in aloft associated with the atmospheric river moving in off the ocean.

The time-height vertical cross section (height in the Y direction, time in the X direction--in UTC/GMT) over Seattle Tacoma Airport shows the situation.  The red lines are temperature.  At 850 hPa (around 5000 ft) the winds were 35 knots, with a temperature of 6C.    The freezing level is at roughly 7500 ft.

The radar at around 2 PM shows the precipitation band approaching the coast and a strong suggestion of rain shadow in the lee of the Olympics (NE side).


The rain will move in later in the afternoon. 

Finally, let me end with a most amazing satellite image (visible).  You see the long cloud band stretching from the Northwest way back into the Pacific?  That is the cloud signature of the atmospheric river....one of the LONGEST atmospheric rivers I have ever seen!


January 26, 2016

Major Atmospheric River Period for the West Coast

The weather action is about to move from the eastern U.S. to the western U.S. as strong atmospheric rivers pummel the West Coast with heavy precipitation, with the potential for a major cyclone to strike California later on the weekend.

One of the best ways to see plumes of moisture associated with atmospheric rivers is to view the integrated water vapor forecasts:  predictions of the total water vapor in a column.  Atmospheric rivers are generally warm and juicy....lots of water in the column.  And when these rivers hit the western U.S. terrain, heavy rain or snow (at high elevations) can occur.

The water vapor image for Wednesday evening shows an atmospheric river reaching the Northwest.


A day later  (4PM Thursday) it aims for northern California.


Friday at 10 AM, it is still directed into central/northern CA.


This atmospheric river is going to have important implications for California, some good (filling reservoirs big time) and some not so good (potential for flooding).

Now let's look at the forecast precipitation from the UW WRF model (12km grid spacing).  For the next 72h, the NW gets the brunt of the atmospheric river, with 5-10 inches in the Olympics, Vancouver Is., and north Cascades.  Northern CA starts to feel the impacts.


Expect some flooding on rivers flowing out of the North Cascades.

During the next 72h the atmospheric river aims directly at CA and the Sierra gets the hardest hit of the past few years, with the model going for 5-10 inches of precipitation on that range.


How much snow in the mountains you ask?  For the first 72h, not much snow over the Northwest because the atmospheric river will be quite warm.  Sorry. BC does better being farther north.


But snow lovers should not be too concerned.  During the next 72h, as the atmospheric river and its associated warmth slide southward, cooler temperatures and substantial snow extend over the Washington Cascades.    Importantly, the Sierra, being of higher elevation, gets feet of snow.   

The total precipitation from the NOAA/NWS GFS model from now through Tuesday at 10 AM PST?  Very wet, with 5-10 inches over the Sierra, Cascades, and coastal mountains.

In short, a water bonanza for the western U.S., topping off Pacific Northwest reservoirs and snowpack and proving a huge influx of water for California. Expect to see major reservoirs, like Shasta, at 80%  of normal within a week.


And then there is the potential for a major windstorm.  The European Center model brings one into the Northwest in a few days, while the U.S. GFS has a big storm predicted for California on Sunday (see below).  Too much uncertainty at this point, so stay tuned.  This might not happen.


January 24, 2016

Saving Public Radio in Western Washington: Financing an Independent KPLU and Reforming KUOW

If we care about public radio in western Washington.
If we believe in independent sources of news and other programming in a period when traditional media (TV news, major papers like the Seattle Times) are hollowing out.

Then we need to act.


Specifically, we must join together to provide funding for the KPLU transition to an independent station rather than being sold to KUOW.

And here is where you need to go: http://kplu.org/save-kplu

The basic situation has been described in this blog and the local media.  Last year, Pacific Lutheran University (PLU) decided to sell its public radio station (KPLU) and made secret plans to transfer KPLU to UW for seven million dollars.  The KPLU staff would have been fired and and the 16-member KPLU news team would have been disbanded.   KUOW, the other Puget Sound public radio station, would get KPLU's superior transmitters, a public radio monopoly in the region, and would maintain some kind of jazz presence on a secondary channel.

KPLU listeners were outraged as were many others.  KPLU is a vibrant, popular station with roughly the same number of listeners as KUOW.   It has an international reputation for quality jazz//blues programming and its award-winning news/local coverage is far superior to the fare provided by KUOW. KPLU has engaging hosts, extensive local and unique programming, and an endearing charm.

The negative reaction to the secret sale was widespread, intense, and effective.  So effective that PLU and the UW agreed to put off the transfer for 6 months, giving a community group time to raise the 7 million dollars.
The bottom line:  if the community can pull together 7 million dollars by June 30th, KPLU will be saved.  If not, KUOW will take on KPLU's assets and KPLU will cease to exist.

There are roughly 430,000 weekly listeners to KPLU.  If everyone gave 20 dollars, it would be over, KPLU would be saved.   But it never works that way. Many folks don't contribute and others need to do more.   After two weeks, roughly $800,000 in pledges have been made, which is an excellent start.

If Paul Allen, Bill or Melinda Gates, Jeff Bezos, or one the fortunate hi-tech millionaires in town are reading this, please consider a major donation...that could make a huge difference.

An independent KPLU would not be just as good as it is today, it could be even better, unfettered by the constraints imposed on it by PLU.  It would be deeply responsive to its listeners.

And then there is KUOW.  Its leadership it still lusting after KPLU's superior transmitters and the potential to have a monopoly on local pledge money.  Go to the KUOW's web site and they have all kind of information of how they are getting ready "just in case" and how excellent their offerings would be if they took over KPLU.
From the KUOW website.

KUOW even has a letter on its web site detailing what they would do if they took over KPLU....and it is very disturbing reading.  Instead of keeping KPLU's beloved jazz programming and hosts, KUOW hired an outsider to design its jazz outlet.    KUOW would hire four new news staffers, but KPLU has 16 reporters/new staff.  The result?  A loss of 12 news folks.  And KUOW has no plans for additional local programming.

KUOW management is saying there is too much "duplication" in having two public radio stations doing news....which makes little sense.  First, the news coverage provided by the stations is very different.  Second, this is like the NY Post telling the NY Times to cease publication because they are both doing NY news stories. Competition is essential and makes everyone better.

This is a situation in which a failing, but money-rich, public radio station wants to take over a highly successful, popular, and superior competitor.  Classic corporate take over.  And I will let you muse over the ethical implications of the use of pledge money, acquired by telling listeners it was needed for keeping the lights on, and the turning around and using the money for a takeover.

And don't doubt that KUOW is failing.  During the past few years, it has gotten rid of most of its local programming, such as the popular Weekday show, and replaced it with nationally syndicated pablum.   KUOW listenership is declining, while KPLU's in increasing.  Want the proof?  Here are the weekly radio listenership statistics for 2009, 2010, 2014, and 2015 (I blanked out the middle two years because of the 2012 election, which skews the statistics).  KPLU (blue) is up.  KUOW (red is down).  KING-FM (classical music) is up.


KUOW listeners are unhappy:  read the comments on the Facebook site to get a taste of the discontent.

So instead of trying to buy regional dominance by killing the competition, KUOW should use it large financial surplus to greatly enhance its local programming, creating new offerings that are unique and regional.  Start covering the UW with extended interviews with faculty and rebroadcasts of engaging lectures.

Fortunately, the future of our regional public radio is in your hands.  Make a pledge towards building a new independent KPLU and the KUOW wolf will be kept at bay.  Please visit: http://kplu.org/save-kplu

Don't worry little lamb.  After I take over your assets, 
things will be much better for everyone!

January 22, 2016

Why was the Washington DC snowstorm easy to forecast?

Snow is falling around Washington DC right now-- with some locations already with 6 inches on the ground.   About two feet is forecast for the nation's capital, and that forecast has been in place for several days.   There is little doubt they will get that much snow at this point.   A very successful forecast.


And quite honestly, a relatively easy one with modern forecast technology.  It turns out that the difficulty of snow forecasts are not the same....and this one had less uncertainty than many at that location.   Let me show you why.

The general set up was favorable, with cold air in place and a developing low center that was large in scale and positioned sufficiently south and east to draw in cool air, while rotating moisture in aloft (see forecast map for 1 AM PST below, shading is precipitation, solid lines are sea level pressure).


A key numerical weather prediction technology today is ensembles, in which we run our models many times, while slightly different starting points or model physics.  By looking at the spread of the forecasts, meteorologists can secure an idea about the uncertainty of the forecasts.  

Here is the ensemble output (the plume diagram) from the National Weather Service SREF (Short-Range Ensemble Forecast) system made on Thursday at 1 AM for snow accumulation at National Airport (Washington DC) over the next few days.  Time increases to the right.  The colored lines are the varying forecasts.  The black line is the ensemble mean (average of all the ensemble members), which tends to be better than any individual ensemble member.   The lowest snow amount was about 12 inches, the mean around 22 inches, and the max roughly 36 inches (click on the image to expand if you like).


Even the driest ensemble member had a foot!  There was some uncertainty but this modeling system was emphatic about a major snow event.

The National Center for Atmospheric Research has a more sophisticated and higher resolution ensemble system.   Here is the ensemble mean snowfall for runs started at 4 PM Thursday for 24h accumulated snowfall ending Saturday at 4 PM PST.  About 2 feet.  There is a substantial snow gradient to the SE of DC, but if the positioning was off by 50 miles, there would be still be a significant event.


The forecasts at the periphery of the snow shield would be far less certain, but the DC snow forecast is much easier.

I could show you other ensemble forecast systems, but the bottom line was clear: DC was going to get hit with a big event.  

Virtually all of the models available to forecasters locked on to a consistent solution by mid-week.  This is not true of some storms, which are very sensitive to the initial state or model physics (e.g., cloud or precipitation processes).   Midlatitude storms like this are generally more predictable that systems leaving the tropics that transition to midlatitude storms.

Which model did better for this storm, the European Center or the American GFS?  5-8 days out, the European Center was clearly superior for the runs verifying at 4 PM Friday PST.  The U.S. shorter-term forecasts (few days) got the story right.   This highly successful forecast shows the power of modern weather prediction, but this was an easy one.   Some forecasts will still be in error, even a day or two out, when their are large sensitivities to the model initial state or physics.


January 21, 2016

Atmospheric River Update

It has been very wet over the region during the past day.   Here is the 24 hr precipitation ending at 10 AM.  The southern side of the Olympics  and the coastal mountiains have gotten 3-4 inches, with1.5-2 inches over portions of the north Cascades.   And what a rainshadow!  Only .04 inches over northern Whidbey Island.  Puget Sound country has been drenched by 1-2 inches.


The aircraft soundings over Sea Tac Airport shows that profound warming and strong southerly/southwesterly winds moving in aloft (time increases to the left, height is in pressure, 850 is about 5000 ft)

Right now strong easterly flow is maintaining cool air in the passes, where it is still snowing (hard).   This is wet dense snow.  The latest model runs suggest that the warm air air wins out and the precipitation will turn to rain in the passes during the afternoon.  With heavy snow on the mountains, with a good chance of rain on top of it, the avalanche threat is serious.  The passes are  now closed and the NW Avalanche Center is showing high avalanche danger in the mountains.


Atmospheric River Approaches

During the past several weeks, mountain snow lovers have enjoyed a bonanza.
More and more snow, with no rain periods.   Deep soft snow.  Little ice.

But good times are over.  A warm, wet atmospheric river is upon us.  And Cascade Concrete is about to return.

The latest WRF model forecast for the 24-h total precipitation through 4 PM Thursday, shows moderate to heavy precipitation over our region, with over 5 inches in some portions of the Olympics and north Cascades


This precipitation is the result of a relatively narrow plume of moisture coming out of the subtopics....known as an atmospheric river. Below is a forecast of the vertically integrated water vapor for 4 AM--the total amount of water in the vertical.  The atmospheric river (red and white colors) is obvious.

The infrared image at 9 PM Wednesday night shows substantial clouds with the atmospheric river, with moisture streaming from the SW to the NE.


The atmospheric river is associated with strong winds and quite warm temperatures.  Here is the forecast 850 hPa (about 5000 ft) for 4 AM Thursday.  The orange colors shows the warm air.   The snow will rise to around 7000 ft today....well above the passes. Initially, cool easterly flow will keep snow falling in the passes, but sometime today the strong, warm flow will win and rain will fall on the snow.


 If you mix lots of snow with warm temperatures and heavy rains, what do you get?

Avalanche threat.  Particularly in the north Cascades, where the rain will be very heavy.  My colleagues at the NW Avalanche Center have serious warnings out (see below).  Be very careful in the backcountry for the next few days.

More rain on Friday...sorry.


January 19, 2016

Why are the winds so different between the gaps and peaks in the Cascades?

If you are in one of the Cascade passes, what do you think the prevalent wind direction in the winter should be?

You might argue that in the midlatitudes the winds should be predominantly southwesterly or westerly (from the west), as illustrated by Monday morning's vertical radiosonde sounding at Quillayute on the Washington coast (see blue wind pennants below), since winds are generally westerly in our part of the midlatitudes.


But if you guessed westerly you would be wrong.... easterly winds are far more prevalent in the passes (such as Snoqualmie or Stevens).   To prove this, here are the wind directions and speeds at Snoqualmie and Stevens during the past ten days, secured from the nice Northwest Avalanche Center website.

Snoqualmie Pass

Steven's Pass

Most of the time, the winds are EASTERLY, with occasionally westerly periods (with stronger winds) when fronts move through.

But then what is going on at the ridges, saying at the top of Crystal Mountain at 6830 ft?
Crystal Mountain

VERY different.  Winds are rarely easterly, but are typically southerly to westerly.  Much more like the coastal radiosonde in the free air, which is expected since high crest-level stations have good exposure to the prevailing winds and are far less impacted by terrain or gap effects on wind direction.  There can be some acceleration of the winds on peaks or crests.

So that is going on?   The answer is that winds in gaps in the mountains, such as Snoqualmie and Stevens, tend to reflect the pressure differences across the gaps.  The same is true of the Columbia Gorge.  If pressures are higher in eastern WA than western WA, there are generally easterly winds, the opposite westerly winds.

During much of the winter there is cold, dense air in easterly WA (which causes the pressure to rise).  In contrast,  low pressure centers are frequently offshore or approaching our coast.  This configuration results in higher pressure in eastern than western Washington most of the time.

For example, on Monday a trough of low pressure was approaching the coast and that produced an east-west pressure difference (gradient) over WA state (see pressure forecast for 10 AM Monday below).


In contrast, when a front moves through the situation changes.  The front has a pressure trough associated with it and temporarily reverses the pressure gradient (higher pressure to the west of the Cascades).  Here is a nice example of such a reversal that occurred on January 13th at 1 PM.  The result is westerly flow.


As low centers approach the coast, the pressure difference across the Cascades increase, producing strong easterly flow.  That can draw some of the cool, foggy air in the "bowl" of the Columbia Basin up into the passes.  This happened yesterday, something I experienced first hand while cross country skiing near Easton, WA.    As a trough approached the coast yesterday afternoon, fog and low clouds thickened east of the pass.  Here is my view at around 3 PM.  Beautiful snow, but lots of low clouds!


Should I Let AI Write My Blogs?

I spend a lot of time thinking about and writing my blogs.   Could AI apps do the work for me?   Could any of you tell the difference? Well,...