June 30, 2020

The Safety of Outdoor Air for Coronavirus Is Now Obvious

There is now powerful observational evidence that outdoor air is extraordinary safe regarding COVID-19, and the recent protests have helped provide it.   The protests/riots began in Seattle and other cities on May 26th.  Thousands gathered without social distancing and a good 10% had no masks.  They participated in chanting, singing, screaming and other activities that ensured plenty of droplets were injected in the air, and that unhealthful environment was "enhanced" by coughing from tear gas and other agents.

Did this huge exposure result in increased spread of COVID-19?  The answer is clearly no.

Consider Washington's King County, a hotbed of protests starting 26 May (see below).  Both hospitalizations and deaths showed no  upward spike after the protests (the blue line shows May 26th).  We should have seen a signal by now, since the average time to symptoms is approximately five days.


It is important to note that the number of COVID-19 cases is going up modestly in King County, but that is being driven by a near doubling of tests (note that the bottom graph starts earlier).  Much of the media neglects to note the importance of increased testing in finding more cases.


This lack of a coronavirus spike has been noted in every major city in the U.S., something discussed in the Seattle Times today and in many media outlets.


These are huge number of independent experiments in varying environments and climates.  A very good sample. And the obvious conclusion is that COVID-19 has a very difficult time spreading in outdoor air.  There is no other explanation.

Some of you might argue that many of the protestors were young and so would not get very ill.  True enough.  But young people can get sick from it and they could certainly give it to their parents, neighbors, and folks in food stores and restaurants.  There were plenty of teenagers and folks in their early 20s still living at home who were at the protests.

You want more evidence?  No problem. About a month ago, there was a huge media commotion about "irresponsible" outdoor parties at Missouri's Lake of the Ozarks (see picture below from the famous "party cove".  Several media outlets promised a huge uptick in COVID-19 cases.


What actually happened?  Nothing.  No spike of COVID-19 cases in the neighboring counties.  Outdoor air is safe.


________________________________________________________________________________

The lack of outdoor transmission is consistent with the scientific literature.  There is in fact no documentation of effective outdoor transmission of coronavirus (see my earlier blog for documentation).    Some examples of scientific papers discussing the issue, include:

Qian et al., 2020:   Examined 1245 confirmed cases in 120 cities in China and identified only a single outbreak in an outdoor environment, which involved two cases. 

Nishiura et al., 2020:  Transmission of COVID-19 in a closed environment was 18.7 times greater compared to an open-air environment (95% confidence interval).

The reasons for a lack of outdoor transmission are clear:

  • Virus concentration are low outdoors because of the tremendous dispersion of the virus in the outside environment.  This results in low viral concentration.  
  • Solar radiation rapidly kills the virus.
  • Higher humidity in the outside air is bad for transmission.
  • Social distancing is much easier outside.

We have folks going outside with great fear, even wearing masks when they are alone or distant from others.

The other day I was biking down the Burke Gilman trail and an older women saw me coming and fled off the trail, pushing her mask tight around her mouth as she turned to face away from me.  There was profound fear in her eyes and it was completely unnecessary.  Really bothered me.

And such fear is being stoked by local politicians and governments.  The City of Seattle parks STILL has many of the parking lots closed and threatening signs everything.

Completely inconsistent with scientific evidence and even the Mayor's Office's own statement on the lack of transmission during the protests.  Talk about being anti-science and irrational.

Take a look at the welcome provide by Seattle Parks and Recreation for Magnuson Park, one of the city's jewels.  Why does the Mayor allow this situation to continue?  City parks should be completely opened.


_______________________________________________________

Additional Material

One commenter noted that percentage of positive test are increasing recently, indicating viral spread.  This is true.  But as shown by the plots of positive percentiles for Washington State (and daily tests), the rate of positives fell for WEEKS after the protests (which started at the time of the blue line).  The minimum was in mid-June.  The positive percentage is a very fast reacting measure of increase of COVID-19 transmission and there is NO hint of a surge with the advent of the protests.  More recent rises, in WA and for most of the country, are associated with lessening of restrictions and lockdowns.


PS:  Wearing masks is a very, very good thing if you are indoors.   More than a good thing-- necessary in all public indoor spaces.


June 28, 2020

A Big Fireworks Pollution Question Will Be Answered Next Weekend

Every year there is a major air pollution spike on the fourth of July, with small particles (PM2.5) surging during the evening.  To illustrate, here are the concentrations of small particles (PM2.5, sizes less than 2.5 microns) for June 15 to July 15th for 2018 and 2019.  Huge upticks of pollutions for late July 4th and early July 5th.  

 2019

2018
These high levels of small particles are quite unhealthful, aggravating ailments such as asthma and heart disease.

There are, of course, two sources of the such fireworks pollution:  large community displays and personal fireworks.   The former typically use large shells propelled by large mortars, injecting more particles higher into the atmosphere.  Personal fireworks are more numerous and widespread, but the densest concentrations of pollutants are near the surface.


I have always wondered:  what are the relative contributions of the professional/community displays versus personal fireworks in terms of contributions to air pollution and the big spikes in particles (like shown below).   It was difficult to secure an answer because both happened at the same time.

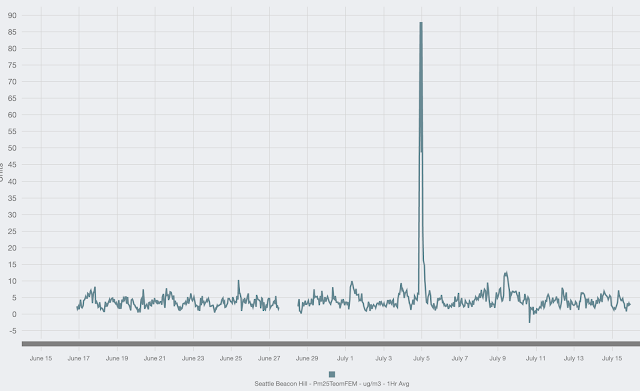
But this year, a controlled experiment is going to take place on July 4th:  most community fireworks displayed were cancelled, while there are reports of "healthy" sales of personal fireworks.   Will there be a similar peak in pollutants?   Will air quality decline more because folks will go for big shows to provide distraction from all their current troubles?   We will know by next Sunday.


June 26, 2020

The Radar Shows Heavy Rain Offshore Without Clouds: How Can That Be?

The radar imagery from the National Weather Service Langley Hill radar near Hoquiam showed heavy showers over the coastal waters last night.   To illustrate, here is the radar imagery over the Northwest for 1:14 AM this morning.   The reds indicate heavy precipitation!  Was it pouring offshore?


A look at the infrared satellite image at the same time shows no weather disturbances out there (see below).  Just some clouds to the north (associated with system that will bring us rain on Saturday).


A high resolution visible satellite image taken just before sunset on Thursday confirms the lack of weather offshore.   But note the low stratus and fog right along the coast....that will be important later!


So is the expensive Langley Hill radar broken?     Is rain falling out of clear skies?   Is there an explanation for this mystery?

There is an answer:   super bending of the Langley Hill radar beam by an unusually strong and low inversion, where temperature increases with height.

Let us take a look at the vertical sounding of temperature, dew point, and winds with height from the balloon-borne radiosonde released at Forks, on the Washington coast, around 5 AM this morning.  

Note how temperature (the right-hand line) increases with height in the lower atmosphere.  That represents an inversion.  The left line is dew point temperature; when dew point and temperature are the same, the air is saturated, which was true near the surface.

Yesterday afternoon, cool, but shallow, marine air moved into the coast, while warm air remained aloft.  The result was a fairly strong inversion in the lower atmosphere.  The visible satellite image showing the low clouds on the coast were a hint of what was going on.

So why do we care about inversions?   Because they can bend the radar beams (which are in the microwave portion of the electromagnetic spectrum--around 10 cm in wavelength).    

A strong inversion can bend the radar beam down to the earth's surface in what is known as superrefraction (see image).  The earth's surface (in this case the ocean) is a pretty decent reflector of the radar signal and a good amount propagates back to the radar, giving a false signal of heavy precipitation.  That is why the radar showed the arc of supposedly heavy rain offshore.   Totally bogus.


Now in the typical atmosphere, with denser air at low levels and less dense air above, there is normally some bending of the radar beam, which is a good thing because it gives the radar greater range (see below)


There was simply too much of a good thing last night!  And don't worry, real rain will get to Washington this weekend, with our weekend weather curse continuing.


June 24, 2020

A Wet British Columbia is Good for Washington State

During the past several years, a major source of wildfire smoke has been the forests in British Columbia.

Just like Washington State, many of the forests have not been well-maintained, growing dense, unhealthy and prone to wildfires.  And smoke from such fires often makes its way into Washington State, as illustrated by July 18, 2017 MODIS satellite imagery:


But the late spring this year has been generally cool, wet, and snowy in British Columbia (see headlines below)


with the the effect of making fire danger quite low right now (see graphic fro British Columbia Wildfire Service).  Blue--very low danger--dominates the lower half of the province. 

And it appears that the wet pattern in southern BC is not going to end soon.

The latest ensemble forecast of accumulated precipitation (running the model many times and taking the average) from the European Center system (the best in the world) through July 9, shows wet conditions in southern BC and northeast Washington.


The precipitation anomaly (difference from normal) for that period (below) shows that some of the values near the Rockies and the far southern part of the province are 1.5-3 inches above normal.

And the thirty day  anomaly encompassing July 7-August 7th continues to be wetter than normal over BC.  And western Washington as well.  This should keep down the fire threat.


The bottom line in all this is that you can probably "breath easy" regarding BC wildfire smoke for the early to mid-summer.   Certainly, a respite that will be welcome with all the COVID and protest/riot worries these days.  And healthy precipitation in BC will help keep the Columbia and other rivers high and cool, which is good news for fish.

June 22, 2020

The Real Victim of Trump’s Sharpiegate: NOAA Administrator Neil Jacobs

There are few things worse than doing something unethical or wrong and then allowing another person to take the blame for the transgression.  Even worse is when victim is portrayed as the offender and then attacked by the very folks that should be supporting the victim.

This kind of unfortunate activity was done by President Trump and some of his staff in the Office of the President, aided by high level political appointees in the Department of Commerce.

The victim?    Acting NOAA administrator Dr. Neil Jacobs.

The scapegoat

The transgression?  Sharpiegate

This has all come to a head recently, with recent reports by the NOAA Integrity Officer and NAPA (the National Academy for Public Administration) and articles in both the NY Times and the Washington Post.

A Brief Review of Sharpiegate

The incident began with Trump's tweet on Sept. 1, 2019 in which he suggested that South Carolina, North Carolina, Georgia and Alabama would be hit much harder than expected by Hurricane Dorian.  Trump was correct about the Carolinas but wrong about Alabama -- with the updated forecast track a sharply reduced threat to Alabama.


Within 20 minutes of Trump's tweet, the Birmingham Alabama NWS responded:


Those NWS folks made a blanket statement that Dorian would have no impact on Alabama, which was too strong since the updated forecasts on Sunday morning had a small probability (5-10%) of tropical storm winds reaching Alabama. Furthermore, as the storm passed there WERE modest impacts on Alabama, with winds gusting to around 25 mph.  And sinking air forced by the storm resulted in several daily temperature records being broken in Alabama. 

Now, you would think that this was a really small story, with Trump making a small error in one his tweets.  Who would ever depend on Trump’s tweets for an important weather forecast?  But in this hyper-partisan world, many media sources pushed stories making fun of Trump, describing how he was undermining weather prediction (see CNN headline below).


It is clear that the President was uninformed about hurricanes and he made a mistake on the Alabama threat.  But the media went into hyper mocking mode and tried to score some points on him...and this President doesn't like to be mocked and became defensive.  In the end, one person was going to pay the price for it:  acting NOAA administrator Neil Jacobs

Sharpiegate

The next stage of this sad drama occurred the next Wednesday when President Trump talked about the hurricane and used an OLD National Hurricane Center forecast uncertainty chart (see below).   He was correct in saying that the previous track took the storm into Florida and the Gulf, but did not know that the latest predictions swung the storm north.  Someone had put a black line going into Alabama—presumably with a sharpie pen.   Trump never discussed it.


But that unmentioned line cause the media and some others to go wild, claiming he was deceiving the public, illegally altering official NOAA charts and more.    This reaction was excessive and was meant to put Trump on the defensive.  And it did.

According to a number of sources,  Trump told his Chief of Staff, Mike Mulvaney to have NOAA deal with the situation.  Mulvaney then called Wilbur Ross, Commerce Secretary, who in turn telephoned Neil Jacobs, Acting Administrator of NOAA.    Ross’ call implied that Jacobs and others were vulnerable if something wasn't done. 

Neil Jacob's Dilemma

Dr. Neil Jacobs, who is now acting administrator NOAA, was previously chief scientist for Panasonic’s weather business and an expert in numerical weather prediction.   I have known him for a number of years and have the greatest respect for him, both as a scientist and as a straight-shooting, ethical individual.  Although a Trump appointee, Dr. Jacobs is not political, but extraordinarily dedicated to improving U.S. weather prediction.  An outside agent of change that NOAA has needed for a long time.   But he is a young man without extensive experience in DC and dealing with its shark-filled political waters. And he was just about to be bitten by a shark.  In fact, several sharks.

Neil Jacobs

According to the NY Times and a recent report commissioned by NOAA (the NAPA report), Dr. Jacobs pushed back on Secretary of Commerce Ross' demands of a strong statement supporting the president (these demands by Commerce leadership and the White House were totally inappropriate). 

Neil Jacobs was under great pressure.  What should he do?  Neil knew that the Trump administration was supportive of improving U.S. weather prediction..    So should he resign and publicly oppose the President, jeopardizing the potential to enhance weather prediction, which would save lives and property?  Or should he revise a harsh statement produce by Commerce folks to one that was completely true but far more benign.  A statement that any real meteorologist would immediately know as meaningless, but would satisfy the weather-ignorant in the Trump administration?

Which was the ethical choice?  The choice of integrity?  The best for the American people?  I believe Neil made the correct choice.  But he would pay a price for it.

On Sept. 6, the following statement, substantially massaged by Dr. Jacobs, was released by NOAA:
The first paragraph is completely correct--the National Hurricane Center guidance DID have some probability of tropical storm force winds reaching Alabama during that period.   The second paragraph was also true:  the Birmingham NWS forecasters said there would be NO IMPACTS and did not qualify the risks (impacts of what?, their tweet suggested the chances were zero % rather than the predicted 5-10%).     
  
So the NOAA statement was entirely true and did NOT say that Birmingham office tweet was wrong, just that it would have been better to note the probabilities.  And apparently this artfully true/vague statement was allowed to replace a far harsher statement prepared by Commerce department leadership. 

You would think that everyone would breathe a sigh of relief in Dr. Jacob’s skillful finesse in dealing with this situation.  But not in this hyper-partisan environment.  And not with some folks in NOAA who were an unhappy with Dr. Jacobs efforts to move the agency to a new paradigm for numerical weather prediction.  The sharks were about to attack.


Scientific Integrity Charges

After the statement went out, there was a hue and cry by some of the media and a few individuals suggesting that NOAA science was being undermined by the statement and that the Birmingham forecasters were being criticized and punished.  One of the main complainants against Dr. Jacobs was a leading NOAA administrator, Craig McLean, who is chief scientist of NOAA (ironically Mr. McLean as an attorney does not have any science background).  

Based on these complaints, the designated NOAA integrity officer, Dr. Stephen Volz, brought in a panel from an independent group (NAPA, National Academy of Public Administration) to evaluate the situation.  None of these individuals were familiar with NOAA or the subject domain.

Their report (here) evaluated three charges.  The first was:

Media guidance issued by NOAA leadership between September 1 and
6, 2019, limited the ability of scientists to communicate with the media and the public
about their research findings. Policies allegedly violated include Section 4.05; Section
4.06; and Section 5.02 (a), (d), and (k) of NOAA’s Scientific Integrity Policy.

This charge was found to be baseless.


On the other hand, NOAA senior leadership was found by the panel to have violated NOAA integrity policy regarding two issues:

The Birmingham WFO forecasters were not provided the opportunity to
review and opine on the September 6 Statement that referenced the September 1
Birmingham Tweet and underlying scientific activity. Policies allegedly violated include
Section 7.01 of NOAA’s Scientific Integrity Policy.

The drafting of the September 6 Statement was driven by external
political pressure from Department of Commerce (Commerce) senior leaders and
inappropriately criticized the September 1 Birmingham Tweet and underlying scientific
activity. Further, the September 6 Statement compromised NOAA’s integrity and
reputation as an independent scientific agency and violated Section 7.02 of NOAA’s
Scientific Integrity Policy.

On the basis of these conclusions, there was been substantial media buzz criticizing Administrator Jacobs and even a call by Congressman Tonko to have Dr. Jacobs resign.

But even a superficial view of these charges quickly reveal they are baseless and ill-informed.

Consider the first “charge”, that the Birmingham forecasters did not have a chance to comment on the statement.  This is just silly.  The section in questions (7.01) does not refer to forecasts or to tweets sent out by forecasters.  It is about science integrity issues regarding research papers and particularly press releases and the like referring to NOAA science researcher’s efforts (you can read the section here).  What makes this particularly nonsensical is that if followed, every NOAA communication would have to be vetted by every supporting information source within the agency.  Thus,  a forecaster in Charleston would have to get the ok from the National Hurricane Center and any office that provided information used in the local prediction.  U.S. weather prediction would be impossible. 

The second charge is also baseless. 

That section says that NOAA officials must not: “Suppress, alter, or otherwise impede the timely release of scientific or technological findings or conclusions:

There was no suppressing of anything in this case; the tweets had already gone out. 

Congressman Tonko

Don’t get me wrong.  This NOAA statement was not a good thing.  The Commerce Department's pressure was inappropriate.  But the mention of the Birmingham NWS office was OPPOSED by Dr. Jacobs in meetings with Commerce officials and he was overruled. The actual statement should be seen for what it was: an attempt to protect the agency by putting out a true but meaningless message that would deflect and end inappropriate pressure by the Trump administration.   You may not agree with Dr. Jacob’s approach, but charges of lack of scientific integrity against him are hurtful and wrong.

The National Weather Service Forecasters in Birmingham Support Dr. Jacobs

You would think that if the NOAA statement was really problematic for NOAA staff, the forecasters at Birmingham would be the first to complain.  The opposite was the case, with the Birmingham office staff supportive of NOAA administrator Jacobs (stories here or here).  To make his support of the local NWS office absolutely clear, Dr. Jacobs spoke to the National Weather Association (a group that encompasses NWS forecasters) and to the local office in question.  They were understanding and not critical of him.  Interestingly, Dr. Jacobs was a classmate of several of the forecasters in the Birmingham office and is still friends with them. No NOAA administrator has been more interested in, knowledgeable about, and more in tune with NWS forecasters.

Dr. Jacob's Visit to the Birmingham NWS Forecast Office

Neil Jacobs Has Been the Change Agent NOAA has Needed

It has been clear for years that NOAA has needed new, more assertive leadership.  U.S. numerical prediction has stagnated (to fourth place in global prediction), satellite systems have had technical problems and huge overruns, and more.  Bringing someone in from the outside was critical (Dr. Jacobs was chief scientist in the Panasonic weather group).    

Dr. Jacobs has been the advocate of a new EPIC center for numerical weather prediction that will help bring NOAA and academic researchers together to improve U.S. numerical prediction.  He has also worked to improve NOAA’s financial management, saving the nation hundreds of millions of dollars.  In fact, several congressmen/women has acknowledged Neil’s role in saving the nation roughly 750 million dollars on satellite acquisition.  For example, Congressman Frank Lucas of the House Environment Committee stated:

I also want to thank Dr. Neil Jacobs for his leadership during this time. Not only are Dr. Jacobs and NOAA producing high-quality data and forecasts, but they are also doing it in a cost-effective manner and saving taxpayers $735 million dollars

But Neil Jacobs' role in dealing with some of the festering problems in NOAA has irritated some long-term NOAA bureaucrats.


The Real Victims of  Sharpiegate:  Dr. Jacobs and the American People

President Trump showed himself to be ill-informed on hurricane Dorian and the attempt to mark up an old forecast chart was comical.  His pressure on NOAA through the Department of Commerce was inappropriate and unethical.    But the attempt of some NOAA administrators, media, and others to attack NOAA acting administrator Neil Jacobs is both wrong and hurtful.  It is an attempt to sully the reputation of an extraordinarily dedicated public servant and administrator, whose passion is to repair and improve U.S. weather prediction capabilities.

It is attacking the victim.  And if they succeed in damaging Dr. Jacobs, who is an extraordinarily effective change agent in NOAA, U.S. weather prediction will be weakened and all the American people will become victims, with poorer warnings and guidance for severe and other weather.


June 20, 2020

Amazing Noctilucent Clouds

One of the most extraordinary and beautiful sights this time of year are the delicate noctilucent clouds that can appear after sunset and before sunrise.

Take a look at a video made by Greg Johnson of Skunk Bay weather showing the celestial show yesterday morning:


Noctilucent clouds are the highest visible clouds, located around 50 miles above the earth surface. Such clouds form when moisture is deposited on dust in the upper atmosphere, generally from meteoritic dust.  Major volcanic ejections can also supply the small particles.

These cloud form in the layer of the atmosphere called the mesophere, where the temperatures are the coldest in the atmosphere.  Specifically, we are talking about temperatures below approximately -185F.   Midsummer is favored because paradoxically that is when the mesosphere is coldest.

NASA even has a satellite (AIM) dedicated to seeing these clouds, as illustrated by an example from June 13th below:


The first report of noctilucent clouds was in 1885 and a number of studies suggest that such clouds are getting more frequent.  

Human's may well have contributed to this increase.  But how?  

It appears that increasing human emission of methane (CH4) into the atmosphere (see below) may be the major cause, with methane breaking down in the upper atmosphere into several components, including water vapor.  More water vapor leads to enhanced ice cloud formation in upper atmosphere.


Another example of the profound effects of human activities on the environment.


June 18, 2020

Beware of Crazy Snowpack Percentages!

Many folks are interested in our mountain snowpack, from hikers and agricultural interests to those concerned about wildfires.

Well, the latest snow water map from the USDA SNOTEL network is an eye opener and a study of contrasts (see below).  For the Olympics, we are now at 283% of normal, for the fire-prone Okanogan highlands of northeast Washington at 265%, and the Blue Mountains southeast of Walla Walla is around 190%.    The western side of the Cascades is very close to normal.  In contrast, east of the central to southern Cascades, snowpack is below normal, ranging from 58 to 35%.

How can we have such huge variation over one state?  Is this believable?

One has to be careful about interpreting such snow percentiles of normal.  On April 1st, the day water resource agencies like to use as a benchmark, the snowpack around the state was very close to normal.   But then we had a warm spell in April  and stronger than normal westerly winds that resulted in a faster-than-normal melt in some locations (such as the eastern slopes of the Cascades). 

During the season of snowpack melt off, small differences can produce wacky percentages of normal, either above or below normal.

Take Waterhole, a site in the Olympic Mountains where snowpack is nearly 300% of normal today (blue is this year and red is normal for snow water equivalent or SWE).   That location was above normal in March and early April and then hit the normal rapid decline in May.   Right now, the amount is above normal by a huge percentage....but there is hardly any snow left (and will be gone in a few days).   The huge percentage above normal is really meaningless.


Now consider a site on the eastern slopes of the central Cascade (Morse Lake), where the  percentile is very low (around 20%).  Again, we started out with a normal snowpack, but the warm weather caused a quicker than normal melt-off (by a week or so.)  The melt-out is a few days early, but you would think the end of the world is here because of the advance of a few days.


And even with an earlier melt-off, in the Yakima drainage much of the water was saved in the reservoir system, ready to aide agriculture and fish passage (see plot below).  In the plot you can see the rapid rise of the stored water (blue line) in April and the fact the water level is now above normal (red line).  Last year is the green line.


At Stevens Pass, the melt-off was June 5th, 3 days later than normal (which means more snow than normal) and the view today at Paradise on Mount Rainier still shows plenty of snow (see below)


The bottom line is that we need to be careful when interpreting snowpack numbers in late spring and early summer, since differences that are meaningless can produce HUGE percentile anomalies from normal.  And as we go into this summer, the snowpack and water situation is quite reasonable and not far off from normal.  Agriculture will have its water and one should not expect unusual wildfire activity.  Something not to worry about.


June 16, 2020

Finally Some Warm/Dry Weather But Then the Weekend Curse Returns

The first half of this month has been unusually wet over much of Washington State, with the exception being the lee (eastern) slopes of the Cascades, where strong downslope winds have provided drying (see below).

Over the past month in Seattle, we have had about 3.1 inches, about double the normal amount.  My garden is quite wet from it all. Wildfire danger is quite low.
The good news is that high pressure will build over the region, and according the European Center forecasts, the temperatures will zoom into the mid-70s on Friday...and conditions will be dry.


But then we get to the curse part of the situation:  a front will move in on Saturday (see 3-h precipitation forecast ending at 11 AM Saturday), with some showers hanging around into Sunday.


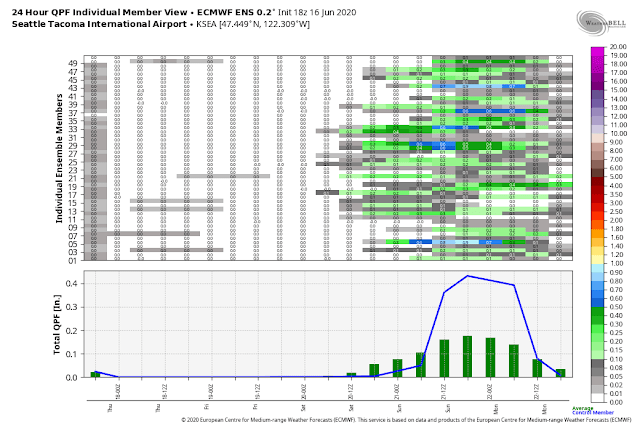
A powerful tool to check out the precipitation situation is to view the forecasts from the 51 member European Model ensemble (below).  The top panel shows the time when precipitation is predicted (shading) for each forecasts and the bottom gives the average of all 51 over time.  Precipitation starts around 5 AM on Saturday and then sticks around into Sunday. Not good.


Yes, there is a weekend curse here in western Washington and I do not have the prophetic skills to tell you when and if it will end.  It does appear that the situation will dry out by the middle of next week.

Should I Let AI Write My Blogs?

I spend a lot of time thinking about and writing my blogs.   Could AI apps do the work for me?   Could any of you tell the difference? Well,...