November 29, 2017

Super Dark Days: Advice from a Meteorologist

Yesterday was an amazingly dark day.  In fact, according to UW meteorologist Mark Albright, it was the darkest day in Seattle (at the UW) since Dec. 8, 2015.  For the technically oriented among you, we had .61 MegaJoules per meter square yesterday, while on December  8, 2015 there was .57.   Essentially the same.  Typically this time of the year we have 2-3 times that amount.

The Seattle Space Needle PanoCan at noon yesterday says it all (see below).
Dark and dismal.


Why so dark?  We start with our northern latitude and the fact that we are within a month of the winter solstice.  Thus, we are near rock bottom for radiation reaching the top of the atmosphere.

Then we are in the cloudiest/stormiest time of the year.  End of November is our worst.

The visible satellite image and the regional radar at noon yesterday tells the story.  Thick clouds and rain greatly reduce the feeble solar radiation reaching the surface.


How bad was it?  Here are the radiation and weather measurements from the roof of my department in Seattle for the 72 hr ending 5 AM today (Wed.)  The bottom panel is solar radiation.

Almost nothing....I couldn't believe it when I first looked at the plot.    The third panel gives temperature (black line).   THE SUN WAS SO FEEBLE THAT THERE WAS NO DAYTIME WARMING.  In fact, temperature dropped during the day.

OK, the sun situation is really bad now.  What do you do?  

Listen to a meteorologist!

My first advice has nothing to do with weather.  Get out during the middle of the day.  Take a walk, go for a run, ride a bike.  Just get outside during the brightest time of the day...that really helps me.

Second, go to whether there are less clouds...and nearly every day there are places to get a lot more light.     For example, head for rain shadow areas in the lee of mountains..

During the winter storm season when southwesterly flow is prevalent, head towards the Olympic Rain Shadow, northeast of the Olympic Mountains.  Northern Whidbey Island, Sequim, Port Townsend, Victoria or the southern San Juan Island will do.


Here is an example...you see the clearing NE of the Olympics?


After fronts go through and the winds turn more westerly, head east of the Cascade crest over the eastern slopes.  Places like Cle Elum. (see satellite image of such a situation).


But during the winter (November to February) don't do too far down into the Columbia Basin.  Why?  Because it often fills up with low clouds.  Very bad.
As shown below.

Sometimes in mid-winter under high pressure, the lowlands are full of low clouds, sometimes from the Willamette Valley to Bellingham.   But the mountains are in the clear! To get out of it, just go up in elevation...drive up to the passes or climb one of our hills.


Now, 10-20 times a year, we get a Puget Sound convergence zone and there are clouds (and often rain) right over Seattle (see below).  Want to escape the murk?  No problemo.  Just head north or south by 10 miles and you will be in sun!


Finally, head up into the snow in our mountains.   Snow reflects solar radiation and makes it much brighter, WHEN there is no active weather going on.

Pretty bright at Snoqualmie Summit!

There are more "secrets" I can tell you, but the message is clear.  Don't be passive in accepting a dark fate. You can do something about it.  90% of the time you can get to a LOT more light with a short drive.

Do what I do on one of the dark days....take a look at the visible satellite imagery (here), find the nearest bright spots, and make your plans!

He May Like the Dark Side.  You don't have to.

November 27, 2017

Fronts Are Stronger Aloft Than At the Surface Here in the Northwest

Another strong Pacific front will come through tomorrow across western Washington State.  The temperature change will be wimpy at the surface, with a decline of only a few degrees.

But go aloft, to say 5000-10,000 ft, and major temperatures declines will occur (5-15F).

So why are fronts so wimpy at low levels around here?  The answer is below.

 Here is the forecast map for 10 AM tomorrow at 700 hPa (about 10,000 ft).  There is a trough of lower pressure along the coast (solid line), with a slug of cold air with it.  If you look closely, you will see a wind shift with the front aloft and a substantial change in temperature behind (roughly a drop from -8 to -14C, a decline of 6C or about 11F)


A map of sea level pressure and 925 hPA  (about 2500 ft) temperature at 7 AM, shows the front making landfall and a temperature drop of only a few degrees C (3-4F).


A wimpy front at low levels and a much stronger front aloft, at least in terms of temperature.  

The larger temperature changes with the front aloft are even more clear cut in a time-height cross section, which shows the temperatures (red lines), winds (barbs), and humidity (color shading) for the next few days (time increases to the left, height in pressure, with 850 being 5000 ft).  Look at the red lines (temperature)....much greater undulations aloft tomorrow (1128/12-1129/00) .
Why are the  surface temperatures variations associated with our vaunted Pacific fronts so weak around here?

Because of the influence of the vast Pacific Ocean.  At the latitude of our coast, the sea surface temperature is roughly 11 C (52F), extending for thousands of miles!
A blow up section off of our coast show 11-12C water temperatures due west of the WA Coast (below).  Cold air moves off of Asia and Alaska at all levels, but is rapidly warmed over the lower few thousand feet by the relatively warm ocean.  Over time the temperature contrasts with fronts are weakened at low levels, but remain fairly strong aloft.  Those are the fronts that reached our shores.


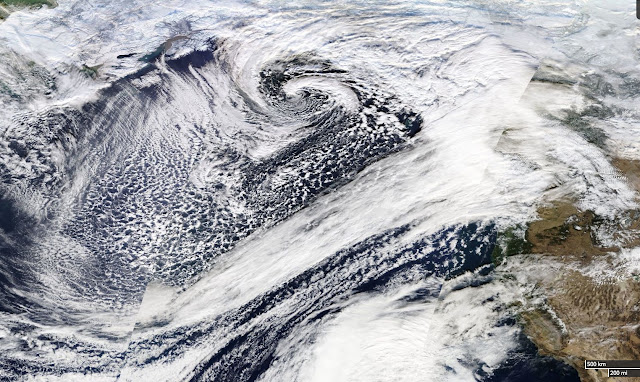
Want to see the process from space?  Here is a NASA MODIS satellite image from Saturday over the north Pacific.  You can see cold air streaming off of Asia to Alaska, produce lines of clouds resulting from the instability of cold air over warm water.  This process results in warming of the lower atmosphere.


November 25, 2017

The Fall So Far

We are now over two months into autumn....what kind of fall has it been? 

Temperature-wise over the West Coast (see below)...nothing unusual.  Slightly cooler than normal over most of Washington and Oregon, grading to warmer than normal over the southernmost portions of California.  Toasty in Arizona.


Precipitation has been a bit more interesting.  Coastal Washington and northwest Oregon has been substantially wetter than normal, as have the western slopes of the Cascades.  This last week, of course has been quite wet.


Slightly drier than normal in southern CA.

All the precipitation has been good for business in terms of filling area reservoirs.   The critical Yakima reservoir system is well above normal (blue is current and red is normal), with the combination of heavy precipitation and warmth causing a huge rise in the reservoir levels the past few days. (Note that the current reservoir storage is what would be normal for middle January).

 So things are looking good for Yakima Valley's agriculture next year.   Lots of hops, grapes, and veggies.  Seattle's reservoirs are in good shape as well.

An important element of the eastern WA water supply is the snowpack, and the latest graphic of the snow-water content of the regional snowpack is generally near normal.   Unusually large values in the sodden Olympic Range.  Importantly, the Sierra Nevada snowpack is excellent.


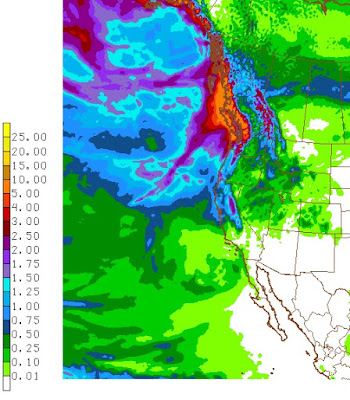
What about the next week?  One weather system after another...with nothing serious (e.g., big winds or heavy rains).  One-week totals from the NWS GFS model (below) are substantial (5-10 inches) over the Olympics, North Cascades and southern BC, and even northern CA gets wetted down.

And there is some good news for skiers.  

Temperatures have been cooling, and although there will be some brief warm interludes, there will be snow at higher elevations above the mountains (particularly above 4000 ft).  The 72hr total snowfall ending 4 PM Wednesday (below) shows several feet of new snow at elevation.  Snoqualmie will be too warm.  Sorry.


In general, a typical fall for our region.

November 23, 2017

Temperature Records On Wednesday. Why?

Yesterday was a very warm day across the region, with many locations 15-20F above normal and several stations achieving daily records. 

Here are the highs on Wednesday.  The lowlands of western Oregon and Washington were in the low to mid 60sF, with some favored locations (south of Tacoma) hitting 70F. 


Some daily records were broken.  Here is a nice graphic produced by the Seattle NWS Office, showing the high temps, with the stars indicating daily records.


The reason for this warmth was that we had the perfect set up for a strong atmospheric river event, with warm/moist tropical air moving northward.  The map below shows the upper level flow at 500 hPa (about 18,000 ft) at 4 PM Wednesday.  Big ridge of high pressure over the southwest U.S. and a strong trough over the eastern Pacific.  The perfect configuration to produce a narrow current of warm, moist from the southwest that hits the NW. 


 To see what is unusual about this pattern, here are the anomalies--the differences of the heights (or pressures) at that level from normal.  Unusual ridge centered on Utah, with anomalous low pressure to the east and west.


The following figures shows the climatology of  4 PM surface temperature at Quillayte, on the WA coast, based on over a half-century of data.  The red lines show the daily maximum and the circle shows yesterday's observation.  You will note that we were near the daily maximum, but there were several days in November with similar (or even higher temperatures).   This pattern has happened before.

Now, Seattle's wacky local alternative newspaper (the Stranger) is making claims that this is proof of global warming (see below), but that claim has little basis in truth.

One can only make a case for global warming based on trends over an extended period, not one extreme event.  So why don't we look at the long-term (1900-2016) trend of average November maximum temperature over the Puget Sound lowlands for a period of more than a century (this is from the NOAA/NWS climate division data)?    Not much trend there!


And this lack of trend makes perfect sense because the surface eastern Pacific Ocean is warming up more slowly than almost any place on the planet.   And there is no research to suggest that the anomaly patterns shown above will become more frequent under global warming....this is an areas of research that I am working on.

The air above us is rapidly cooling and the Aloha breezes will fade.  Something to contemplate while you eat your turkey today.

November 22, 2017

Tropical Air over Seattle

Breath deeply this morning. 

A few days earlier the air was over the tropics.  Moist, warm and soothing to our wind and cold whipped skin.  And we just broke a major low temperature record.  This morning, our low temperature (56F) was the HIGHEST low temperature ever recorded in November at Seattle Tacoma Airport.  That is a big record to break.

Yesterday, Bellingham broke their daily high temperature record (60F) and today all sorts of daily high temperature records will be broken around the region.  


To certify the tropical origins of our air, I used the NOAA Hysplit trajectory model to trace the origin of the air above us at 500 meters (blue), 1500 meters (red), and 3000 meters (green) for the past 150 hours.  Our low level air, came from just east of Hawaii.  The 1500 meter air from the deep tropics.  No wonder many of us are fighting the urge to grab a Mai Tai today.


A plot of the winds and temperatures above Seattle for the past day (below), shows a freezing level of 10,000 feet, with strong southwesterly winds aloft--a sign of a potent atmospheric river event.

Over the past 24 hr (ending 5 AM), portions of the SW slopes of the Olympics received over 6 inches of rain, with the north Cascades getting as much as 3-5 inches.


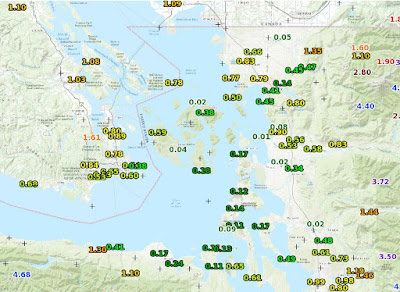
But perhaps more impressive than the rain on the windward sides of the mountains, is the profound rain shadowing in the lee of the Olympics, where some locations only received 1-2 hundredths of an inch (see below).  Just amazing.


However, the wacky weather award yesterday had to go to Bellingham, Washington, where in less than an hour (around 4 PM Tuesday),  the winds turned southerly and surged to over 40 knots, and the temperature rose from 46 to 60F (see report below).


The temperature trace there shows the story and the fact the temperatures are EVEN WARMER right now--62F (and there are strong winds at Bellingham currently as well).
Perhaps just as unusual was the existence of sea fog (a.k.a., warm advection fog) over Lake Washington  this morning (see below).  The air was so humid and warm (dew point at Seattle-Tacoma Airport was 57F at 7 AM), that the cooler waters of Lake Washington (51F according to the Lake WA buoy) was able to bring the air to saturation.


The temperatures today will delight you.  A plot of temperatures during the past two weeks at Seattle shows that our current morning temperatures are WAY higher than the normal highs (purple line below).
 And the UW high resolution model forecast for surface air temperature at 2 PM  today shows 60s all over western Washington.  Some locations in the upper 60s.


 So pull out a short-sleeve shirt and breath in the tropical air.  Today, will not feel like normal Seattle weather fare of November.


November 21, 2017

Warm Temperature Records Will Fall As A Strong Atmospheric River Hits the Pacific Northwest

The next 48-hr will be stunning in a number of ways:  very heavy precipitation in the mountains, river flooding, and temperatures that will reach record levels.

The forecast for today at 1 PM, shows the story, a strong plume of moisture from the south that is heading directly into the Northwest (blue and white colors indicate the largest values).


The moisture channel satellite image from last night at 9:30 PM shows an amazing plume of water vapor heading directly from the tropics.  It has our name on it.

Accompanying this plume of tropical moisture will be near-tropical warmth, something illustrated by a forecast chart for 1 PM Tuesday at the 850 hPa (about 5000 ft) level.  Red/orange are warm temperatures, driven northward by powerful southwesterly flow aloft


Or we could look at the forecast temperatures (red lines, °C), winds, and humidity (shading) over Seattle (see below). Time increases to the left and the heights are in pressure (700 hPa is 10,000 ft). The blue line is the freezing (0°C) level. 

Unbelievable...the freezing level rises about 10,000 ft.  This means rain everywhere...even over the high terrain of the Cascades.  The atmosphere is very moist (green colors), with strong southwesterly winds aloft.


Now let me show you the  forecast precipitation with 24 hour totals.

Ending 4 PM Tuesday...heavy rain in the mountains, with 2-5 inches in the Olympics.

 Even more the next 24h (ending Wed. at 4 PM)

 Just as much the next 24 h.  Yikes.


Add them all together for the 72h total ending 4 PM Turkey Day.  Much of the mountains get 5-10 inches, with a few places in the Olympics getting more.  Expect flooding on a number of rivers. And  yes, our snow will do some serious melting.


 But what really will be amazing will be the temperatures.  Here are the forecasts from the National Weather Service SREF ensemble for Seattle...many of the members will reach into the LOWER 60s on Wednesday....probably breaking the daily record.


Well...this is climatologically the wettest weak of the year!

Are Eastern Pacific Cyclones Become More Frequent or Stronger?

 During the past three days, I have  received several calls from media folks asking the same question:  Are storms like this week's &quo...