May 30, 2017

The Cold Blob is here: what does this imply for this summer?

There is "The Force" and the "Dark Side of the Force"

There is matter and anti-matter.

And yes, there is Donald Trump and Hillary Clinton

All polar opposites.

But there is another contrasting pair that all meteorologists should be familiar with:

"The Warm Blob" and the "The Cold Blob"    Also known as the Blob and the Anti-Blob


This Blob blog will tell you about the current situation and correct some misconceptions in the public domain about this misunderstood creature of the Pacific.

Many of you know about the warm Blob, a persistent area of warm water over the eastern Pacific (see image for the sea surface temperature anomaly, difference from normal, for Feb-March 2014).  This was a very strong Blob, with localized eastern Pacific waters as much as 4-7F about normal.
 One to two years ago, the warm blob was evident and the media took a LOT of notice.   Some suggested it caused our warm weather.  Some said it was the result of global warming.  The truth is that the warm blob was the tail, not the dog, and was forced by persistent high pressure over the eastern Pacific.

Many Blob lovers were dismayed with a dramatic change during the last year, with the warm Blob disappearing and shockingly, a cold Blob taking its place.  But few in the media covered this radical shift (for reasons I will let each of you imagine).

Here is a map of sea surface temperature (SST) anomalies (again difference from normal) for a few days ago.  Blue is colder than normal.  A cold Blob is off the West Coast, with temperatures reaching roughly 1.5 C (~2.5F) colder than typical.  Enough to put a chill down your back.

Why the chilly eastern Pacific?

Because instead of the high pressure anomaly that was over the eastern Pacific during 2014 and 2015, the atmosphere switched to a low pressure anomaly (a persistent trough) during the past winter.  To prove this to you, here are the 3-month 500-hPa height anomalies (difference from average) for October to December and January to March (blue indicates lower than normal heights--think of it as low pressure).  Low pressure is associated with stormier conditions that mix up the upper ocean (bring colder water to the surface).


What do the latest computer model forecasts suggest for the cold BLOB?  Here is the forecast of the large international medium range ensemble system (IMME), providing the predicted SST anomalies for June, July, August.   The cold Blob is still there, but weakens, with most of the northeast Pacific being near normal.
So what does this imply about our summer weather?

Not much.   

The effects of the surface temperature of the Pacific on our air temperatures are very modest, something I have proven with a series of simulation experiments in which I exchanged the warm Blob temperatures with normal conditions.   Only cooled the region west of the Cascade crest by a few degrees.    So having slightly cooler temperatures offshore will not stop a heat wave, but might contribute to a slightly cooler summer.

I do have some good news for Blob lovers:  there will be a modern remake of the old movie classic, including "Snakes on the Plane" star Samuel L. Jackson.   I can see it now.....perhaps he will be a meteorologist.... I have had enough of those **** Blobs in the **** Pacific Ocean.  It will be marvelous.

May 28, 2017

Spring Stratus Inundates the Eastern Pacific

Every spring it happens---the eastern Pacific, offshore of the West Coast, fills with stratus--and this year is no different.  This norming's Norhtwest visible satellite imagery show stratus/stratocumulus over the offshore waters, with some of it extending eastward  into the Strait of Juan de Fuca and south of the Olympics.   This onshore extension is being encouraged by a weak onshore pressure gradient (about 1 hPa higher at Hoquiam than Seattle).  Small variations in the east-west pressure differences controls our summer weather.


Pulling back to see the entire West Coast,  there are clouds offshore from southern California to British Columbia.  We are all in this coastal soup together.  And for the same reason:  an extensive area of high pressure!


A few days ago, a ridge of high pressure started building offshore (see upper level, 500 hPa, map for 5 AM Thursday.


But as the days passed, the ridge slowly drifted eastward (see map for 5 AM Saturday).  But still impressive.


Building high pressure offshore is good for coastal stratus development in many ways. High pressure aloft is associated with sinking (or subsidence) that weakens towards the surface.  Sinking causes warming by compression, so there is more warming aloft.  Plus, air near the surface is cooled by contact with the cold Pacific.  Both of these mechanism tends to create an inversion (warming with height) above the surface, which is very stable (fights against vertical mixing).  That leaves a shallow layer near the ocean that is cold and moist--and full of stratus/stratocumulus.   Higher pressure offshore at low levels helps to gently push the marine air into western Washington.

Let me illustrate what is going to by showing you a vertical sounding at 5 AM this morning from a balloon-borne radiosonde at Quillayute, on the WA coast. Red is temperature, blue dots indicate dew point, a measure of moisture. Very nice inversion at low levels (temp increasing with height) and shallow saturated layer (temp and dew point the same) near the surface.  The air is actually quite dry aloft (dew point and temperature are separated).

High pressure becomes more persistent in June over the eastern Pacific and low clouds will be a familiar sight.  The result for the Northwest?   June gloom with lots of low clouds and temperatures in the 60s.  Enjoy.

May 26, 2017

Seattle Versus San Francisco Weather: Our Summers Are Better

Seattle folks sometime feel a bit of an inferiority complex relative to the denizens of the Bay area, with some suggesting that the SF area has better weather.  But the truth is that Seattle has better late spring/summer weather and this weekend is a good example.

The Space Needle Pano Cam at 11 AM Friday shows blue skies and perfect weather conditions.


A San Francisco cam show dreary low clouds.  Depressing.   So bad that the airport had extensive delays.  Seattle has much nice buildings by the way


Take a look at the visible satellite imagery Friday morning. Western WA is clear, with a some low clouds offshore.

 The Bay Area is all socked in.  And there is a low pressure center offshore with spiraling cloud bands.  Looks scary.


The weather.com 5-day weather prediction for Seattle is forecasting superb conditions, with temperatures rising into the lower 80s for the entire weekend.


San Francisco has a bleak outlook, with highs in the lower 60S and lots of clouds. Depressing.


I know what some of you are thinking....this is just one weekend.   Does SF really have inferior summers?   Well, lets look at the climatologies for both cities.   Seattle's typical high temps (red line) peak in late July and August around 73F.

San Francisco only gets into the mid-60s that time of the year.   They have a strange annual temperature variation with their highest temperatures (only around 70F) in September...and this doesn't do them much good, since kids are back in school and folks have returned from their summer vacations.

And now the shocker.... Seattle has MORE HOURS OF SUNSHINE than San Francisco in July and August.  Don't bother looking at other months.


 The bottom line of all this is clear:  Seattle has a nearly perfect summer climate and SF's summers are not quite as good.  And don't forget about the wisdom of Mark Twain:

"The coldest winter I ever spent was a summer in San Francisco."


May 25, 2017

President Trump's Budget Plan Weakens U.S. Weather Prediction

When I read through President Trump's budget plan for NOAA and the National Weather Service, I was both disappointed and disturbed.   One would be hard pressed to come up with a plan that could more effectively undermine our nation's weather prediction capabilities.
And strangely, the proposed budget directly contradicts the Weather Research and Forecasting Innovation Act just passed by the Republican-dominated Congress and SIGNED by President Trump.

Let me review some of the recommendations of the NOAA budget plan---you will not believe them.  

1.  "NOAA requests a reduction of $5,000,000 to slow the transition of advanced modeling research into operations for improved warnings and forecasts. "

The U.S. is behind in numerical weather prediction and Congress had provided funding to replace the aged GFS with a Next Generation Global Prediction System (NGGPS) and other major improvements.  A five million dollar reduction will cripple the National Weather Service's ability to build the new modeling system and will also undermine improvements in hurricane forecasts.


2. "Terminate Investment in Mid-Range Weather Outlooks: NOAA requests a decrease of $5,000,000 to terminate all development, testing, and implementation of experimental products to extend operational weather outlooks, including temperature and precipitation outlooks, from 16 days to 30 days."

Perhaps one of the areas of greatest potential in weather prediction is extended skill into the subseasonal domain (2 weeks to a month).  Subseasonal prediction was the CENTERPIECE of the Weather Research and Forecasting Innovation Act noted above (which was pushed and supported by Republicans in Congress).
And now Trump's folks want to zero it out.   Just wacky.


3.  "NOAA requests a decrease of $11,000,000 to reduce or eliminate components of its Tsunami Research and Operational Warning program. ..Support for preparedness education, outreach, and innovation research will cease. This program change request is consistent with the elimination of the DART® moorings"

There is great concern about loss of life associated with tsunamis, particularly after hundreds of thousands of people died in the Indian Ocean event of 2004.   The West Coast of the U.S. is particularly vulnerable.   A key resource for tsunami prediction is the DART buoy system (see above), which can sense anomalous increases in water level.  Stunningly, the Trump plan would eliminate these buoys (which we have already invested in), putting American and other lives at risk.  Madness.


4. "Reduce Surface and Marine Observations: NOAA will reduce surface and marine observations by $25,989,000, including the National Mesonet Program, Weather and Ocean Platform, and the Tropical Atmosphere Ocean (TAO) array. It also will reduce marine observations that inform forecasts and warnings as well as understanding of global environmental patterns, such as El Niño."

Talk about going blind.  This approach will savage the nation's observation system (such as the high density mesonet program) and end the buoy array over the Pacific, which helps us diagnose and predict El Nino and La Nina.


5. "Eliminate Arctic Research: NOAA requests decreases of $2,230,000 from Climate Laboratories and Cooperative Institutes and $3,770,000 from Regional Climate Data and Information. This reduction will terminate Arctic research focused on improvements to sea ice modeling and predictions that support the safety of fishermen, commercial shippers, cruise ships, and local communities."

One of the key deficiencies for weather and seasonal forecasting is poor understanding of changes in sea ice distribution and how to forecast them.   Trump's budget proposed to terminate all research in this area.  Unbelievable


6. "End Vortex-Southeast: NOAA requests a decrease of $5,000,000 to terminate Vortex-Southeast, a program used to detect, respond to, and warn against tornadoes in the Southeastern United States."

There is much we don't know about the origins and prediction of tornadoes and field programs like Vortex provide critical insights.  But Trump's folks want to terminate this important research program, which is surprising since tornadoes impact many red states.
_____________

These are only a few of the outrageous, irrational cuts listed in the Trump NOAA budget plan.  The result of these and other cutbacks would be to set back U.S. weather prediction several years, giving up any chance of advancing our nation's weather prediction capabilities to state-of-the-science.  

The economic impact of poorer weather predictions would be large and negative.  Bizarrely,  this budget plan directly works against the recently passed Weather Research and Forecasting Innovation Act, that was pushed by Republican leadership in Congress and signed by President Trump.

How can a President pushing to " Make American Great, Again" propose a budget that will "Make America's Weather Prediction Inferior, Again"?
Republican staffers in Congress have told me that Trump's budget is dead on arrival and that they will act to protect the nation's weather prediction capabilities.  Since the worst weather in the nation (e.g., tornadoes, hurricanes, severe thunderstorms) is found in red states, you would expect the Republicans to take weather forecasting seriously.   Most do.

And perhaps there is a silver lining to this situation. Might Trump's crazy budget inspire moderate Republicans and Democrats to work together to put together a rational budget plan for NOAA and other agencies?  One could hope.


May 23, 2017

Major Marine Push Occurring Right Now

8 PM UPDATE

This is really turning into a very unusual (and strong) onshore push event.  Over 10,000 customers have lost power in Western Washington (see PSE map)

The wind gusts were amazing...several locations in the central and eastern Strait of Juan de Fuca got to 50-60 mph--even southward into Puget Sound.  Exposed area in the Cascades gusted to 60-80 mph.


Smith Island, just off northern Whidbey, reached 67 mph (58 knots)! (see below)


Aircraft landing at Sea Tac Airport have reported low-level wind shear on final approach, as indicated by the pilot report (PIREP)

KSEA UUA /OV SEA/TM 0315/FL005/TP B737/RM LLWS +15KT 005-SFC
Winds are northerly at the surface but southerly a few hundred feet aloft._

The Guemes ferry is stopped due to swell. Anacortes is out of power.  Pretty wild stuff.

_____________________________
A huge pressure difference has developed between the Washington coast and the western interior, resulting in a rapid increase in onshore winds.  In some locations, such as the Strait of Juan de Fuca, the winds are blowing as high as 50-60 mph right now!

This table shows differences in pressure (HR is in UTC, 23 is 4 PM).  The Hoquiam minus Seattle pressure difference was up to 5.2 hPa (higher a Hoquiam).    That is HUGE (to quote our President) and always provides a good blow. That will push winds in from the west.


Here are some of the maximum gusts as of 5 PM.  59 mph at Race Rocks at the SE tip of Vancouver Island.  Lots of winds between 30 and 50 mph in the Strait.  40 mph in Shelton.  And it is getting gusty even here in Seattle right now.


The winds at buoy 46088 and Smith Island in the eastern portion of the Strait show accelerating winds to roughly 45 knots (52 mph)...and they aren't done revving up yet!  Fun day to take the Clipper to Victoria.


This situation is a good example of a Northwesterly Onshore Push, a rapid inland surge of marine air initiated by the passage of an upper level trough (see an upper level forecast map for 5 PM below to see the trough).

We had warm air and low pressure over region before the trough, and behind the trough there is cooler air and higher pressure.  The result is a large pressure change (or gradient) and the replacement of the warm air by cool, marine flow.  Known as an onshore or marine push in the weather business and very typical this time of the year.

Tomorrow will be much cooler day, with temperatures falling back into the mid-60s.  But don't get rid of your sunscreen and shorts yet...the ridge of high pressure will rebuild later this week and temperatures will quickly surge into the 70s and low 80s by this weekend.

May 21, 2017

Are Air Conditioners Needed in Seattle Now or in the Future?

The Seattle Times published a story on air conditioning in Seattle, suggesting that "as Seattle summers keep getting hotter and hotter" more apartments are being built with A/C.   In fact, they have a plot suggesting that while only around 4-5 percent of Seattle apartments were built with central air conditioning before 2010, during recent years that number has climbed to 25%!


So one might ask:  do you really need A/C in Seattle and have our summers got "hotter and hotter"?

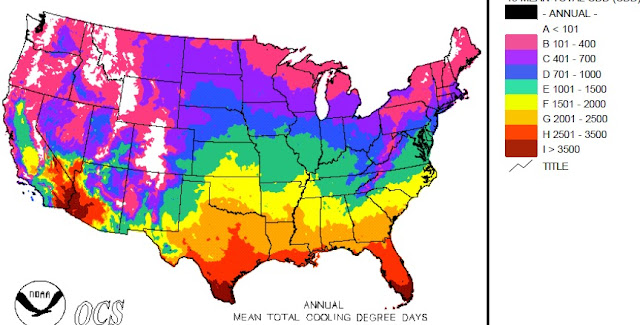
Let's check the facts.  One of the key measures of the need for air conditioning is cooling degree days, which is based on the difference between daily average temperature and 65F.   If the daily average temperature at a location is say 75F, then that day has 10 cooling degree days.  Do this for all days of the year at a location and add them up, and you have annual average degree days.  The idea is that once the daily average temperature reaches 65F (say a high of 80 and low of 50), you start needing A/C.

The map of average annual cooling degree days below shows that western Washington has the some of the lowest numbers of cooling degree days in the nation outside of high terrain.  Much of western WA is white (low numbers) with only central Puget Sound entering the red colors (101-400).  Seattle clearly has the lowest need for cooling of any major US city in the lower 48 states.


In fact, Sperling's Best Places has rated Seattle America's number one summer "Chill City" based on our temperature and humidity.  Seattle Chill--I think I have heard this before.

The reason for Seattle's low number of cooling degree days is clear:  we have some of the coolest summer temperatures in the nation, because western WA generally is covered with cool air from off the Pacific Ocean.  The map of the normal high temperature for August shows this clearly, with our area the only coastal one with a lot of green.   Seattle does better than Portland because we have cool Puget Sound next to the city and there is a sea level passage to cool Pacific air.   Portland has much more need of A/C.

But temperature is only part of the story---humidity is also an important issue for summer comfort.  Higher humidity reduces our ability to cool by sweating, which is a very effective way our species reduces our body temperature.    A good measure of the water content of air is dew point, the temperature at which air becomes saturated (100% RH) when cooled.

Take a look at the dew point map of the US for August below.  The lowland Northwest has LOW dew points (low 50sF)--low levels of moisture in our air.  Which means our relative humidities end up quite low during the day.   Your body can cool effectively from sweating (which may not even be apparent to you).  Compare that situation to the eastern (and particularly southeastern) US where moist, humid air greatly interferes with our natural cooling mechanisms.

Why are our dew points low?  Because of the cool Pacific Ocean....the amount of moisture air can pick up increases with temperature.  Cool water...not much moisture in the air.

But wait...there is more!   Our dry air allows temperatures to cool rapidly at night (water vapor is a powerful greenhouse gas), so our typical daily low temperatures even during a warm spell almost always drop in the 50s.  Open a window or use a window fan, and comfortable sleep is almost always possible.   Finally, even on the warmest days, cooler temperatures are generally very close....just head to the water, since Puget Sound is generally around 50F.

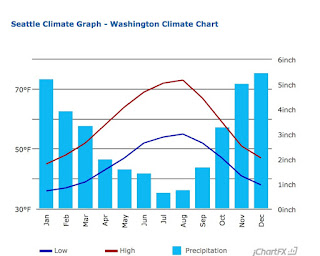
The bottom line of all this is clear:  Seattle is one city where A/C is a luxury that is not particularly needed for buildings in which windows can be opened, except for the most unusual and exceptional days.  Apartments with poor circulation and facing the sun can get warm (and could use A/C).  Typically, Seattle has two days a year when the maximum temperature reaches 90F. 

But what is the trend of Seattle temperatures and how about the future?  Will A/C become a necessity for most, like in Houston?  

To "warm up" the discussion, here are the average June to September temperatures over the Puget Sound lowlands (NOAA WA Climate Division #3) for the past 65 years.  There is a small upward trend with a lot of variability.   Roughly 60.5 F in the 50s to early 70s, and approximately 62F since then.   The transition in the mid-70s may have been due to a mode of natural variability called the Pacific Decadal Oscillation (PDO), which transitioned from the cold to warm phase at that time.  A small human-caused contribution is also possible (from urbanization of our region and increasing CO2).   But the upward trend is modest and quite small for the last 30 years.

There was one crazy warm year recently (2015), which was associated with an usually persistent ridge of high pressure.   Around a DOZEN days reaching 90F at Seattle.  And you will notice some similar heat spikes early in the record.  These transient features were probably the result of natural variability.

The bottom line of this analysis is that there has not been a large warm up over our region during the past decades and increasing temperatures is probably not the reason for more A/C installations.    A/C may be nice on a rare and extreme Seattle hot spell, but generally is unnecessary.  More A/C is like the trend for expensive granite counter tops-- pleasant to have perhaps, but a luxury.  More A/C is probably a better measure of the increasing wealth of our region than of increasing temperatures.


But what about the future?  If A/C may not be necessary now, what about later in the century?
It might be a good idea.   Let me show you the projections from a regional climate simulation that we completed at the University of Washington (credit to Professor Eric Salathe and research scientist Richard Steed).   Specifically, this is number of days per decade that will climb about 90F at Seattle-Tacoma Airport.  This simulation assumes that we keep on burning fossil fuels in a similar way as in the past (which is what is happening I am afraid).

For the 1990s it shows about 50 per decade (4 per year).  The model is overestimating the number of heat waves, probably because it does not have enough resolution to get Puget Sound correct.  2020s?  Pretty much the same story.  2050s--a modest increase to 80 a decade.  But look at the 2090s.  Wow.  A huge increase to 170 a decade (17 a year).  You will probably want air conditioning in Seattle in the 2090s.

Global warming due to human-inspired emissions of greenhouse gases is probably having a small impact on our local temperatures now, but by the end of the century our climate will warm profound.  But we need better information to get a better idea of the local effects.  That includes running regional climate models at higher resolution and running them many times to get a handle on uncertainties.  That is why we are trying to build a regional climate effort at the University of Washington.

And enjoy the perfect weather today...no A/C needed.

May 19, 2017

80 degrees on Tuesday?

The first 80F day of the year in Seattle is always a reason to celebrate, and it looks like Tuesday (and possibly Monday) may be it.

Here is the latest forecasts of the National Weather Service, showing 80F for Monday and 85F for Tuesday..


And the even more skillful prediction of weather.com is going for 82F on Tuesday.


The origin of this warmth is a strong ridge of high pressure that will building over the region on Sunday and Tuesday (the map for 5AM Tuesday for 500 hPa...around 18,000 ft.. is shown below).
The surface pressure and low level temperature map for Monday at 2 PM shows the typical warm-period set up, with a trough of low pressure caused by warm air extending from California into western Washington.

Saturday morning will have considerable low clouds and a few sprinkles over western WA, but by afternoon the clouds should then and temperatures should rise into the mid-60s.  And it is only up from there.....

May 17, 2017

Was Weather Behind the Record Times During the Windermere Crew Races?

On Saturday, May 6th both the men and women's crew broke long-term course records during the famed Windermere Cup races.  As noted by the Seattle Times:

The men’s winning time broke a 20-year-old course record set by Washington in the 1997 Cal dual regatta of 5:30.0. The women’s performance broke the 30-year-old record set by the Soviet Union national team in the 1987 Windermere Cup of 6:11.73.
Picture Courtesy of the University of Washington
What were the chances that both men's and women's teams would beat long-term records on the same day? Even the woman's coach Yasmin Farooq found it hard to understand.

Now I am the last one to detract from the stunning athleticism of the UW men and women's crew teams, some of whom I have had in my classes. They are fierce and disciplined athletes. But perhaps there was a meteorological/environmental factor that enhanced the times of both the Huskies and their competitors that day.

Let me explain.   

None of this was on my radar until I got a call  from someone from the Seattle police department (didn't note his name).  After assuring me that I wasn't in trouble, he told me that he was involved with the crew races and noted that the water seemed to be moving very fast (westward) during the competition in the Montlake cut (see map) ; he wondered whether that might have explained the records.  I mused that we have had a very wet spring and that there was a pulse of water moving into the rivers that weekend from melting mountain snow.  So maybe there was a connection.


The Windermere Cup Crew Races occur upstream of and in the Montlake Cut, a narrow passage between Lake Washington to the east and Lake Union to the west (red oval)

I told I knew who to call:  Larry Schick, lead meteorologist of the U.S. Army Corps of Engineers (USACE) in Seattle.  USACE runs the Hiram M. Chittenden Locks, which controls the water levels in Lake Union and Washington.  Larry was very helpful, and engaged the help of a hydrologist colleague, Adam Price.

The "plumbing"  of the region is relatively simple.  Most of the water that enters Lake Washington does so through the Cedar River (red oval below); that water then flows through the very narrow Montlake Cut (red oval above) into Lake Union and flows westward through the Locks before entering Puget Sound.  The outflow through the Locks and the inflow in the Cedar control the water levels in Lakes Union and Washington (there are minor rivers/streams flowing into the Lake as well).  Generally, the Corps keeps Lake Washington at around 20 feet during the winter and 22 feet in late spring.


This has been a exceptionally wet spring and thus the Army Corps has had to pass a lot of water through the Locks, resulting in strong westward flow in the Montlake cut (the race venue)

However,  the passage of a wet, warm front in early May upped the ante--it not only provided lots of rain, but also melted the bountiful snow in the Cascades.  As a result, the Cedar River surged, as shown by USGS Daily Discharge Data at Renton.  Blue is the actual this month and the orange triangles are normal,  The flow was WAY above normal on May 6th, reaching around 1800 cubic feet per second.  In fact, this was the greatest flow on record at that location on the that date.


According to USACE hydrologist, Adam Price, on race day the Lake Washington level was fairly stable and the Corps maintained an average release rate of 2800 cubic feet per second, enough to balance the Cedar and minor river inflows.  He told me that this was a very high outflow rate in May.   Using the 2800 cubic feet per second number and simple calculations, he determined the flow speed up the narrow Montlake Cut, finding unusually large outflow.  He did the same for normal May flow (850 cfs).   The result demonstrated that the boats were sped up considerably by the strong current, reducing their travel time by roughly 6 seconds.

So the wet spring and rapid warm up  resulted in increased flows that substantially reduced the travel time down the cut, and may have explained (at least partially), the records broken that day.

Interesting, the date of the previous Windermere Cup men's record (May 3, 1997) was also a period of unusually strong flow from the Cedar River into Lake Washington (see below).

The bottom line of all this is that it is possible that a wet spring and rapid snowmelt led to strong flow along the Windermere Cup race course that might have shortened the travel time appreciably.  

And it is only a rumor that the Husky Crew team has suggested that the US Army Corps of Engineers do a rapid release of water during the first Saturday of May 2018 😊


Should I Let AI Write My Blogs?

I spend a lot of time thinking about and writing my blogs.   Could AI apps do the work for me?   Could any of you tell the difference? Well,...