September 30, 2021

The Truth about the "Baroclinic Leaf"

 The media has been going a bit crazy about a very common and usually benign meteorological phenomenon.   

A weather satellite feature called a baroclinic leaf--a thickening of the jet-stream clouds that is associated with the incipient development of midlatitude low-pressure centers.

This tempest in a teapot all started with a tweet by the National Weather Service on Tuesday that mentioned the baroclinic leaf (see below).  The purple arrow points to the feature, which is characterized by a curved mass of clouds.   

 Some folks think it looks like a leaf.  I am not convinced.

 
Below is an infrared satellite image showing the baroclinic leaf at a slightly different time (I put a red oval around it).


We see such features over the Pacific dozens of times each autumn and winter.  The term "baroclinic" indicates it is associated with a horizontal temperature gradient (or change with distance).   A well-known meteorological term.

As noted above, the media went silly about this run-of-the-mill feature.  The Seattle Times incorrectly called it a "rare cloud pattern"

KING-TV talked about a disruption in the blending of warm and cold fronts, whatever that means.


And the Seattle Stranger, never a place to get reliable weather information, said the  leaf was "uniquely moist" and "pretty."


Baroclinic Leaf 101

I teach weather satellite interpretation in several classes and often describe the details of the baroclinic leaf.  Let me tell you about it and what it tells us about the development of midlatitude storms from space.

Below is a schematic showing the development of a typical midlatitude cyclone. The shaded areas indicate clouds, the solid lines show heights (pressures) at mid-levels in the atmosphere (around 500 hPa, 18,000 ft).  The fronts are shown in blue, the surface low center with an "L" and the core of the jet stream (the current of strong westerly winds in the midlatitudes) by the dark solid lines.


As a weather system develops, we start with a rather linear cloud feature of near-uniform width.  As the system revs up, the clouds get curved and distorted, with the southern part being narrower.  This is the baroclinic leaf stage.

And as the low center strengthens, the cloud field transforms into a "comma"--lower right box.

Here is another rendition of the leaf (left panel) and comma (right) stages.


As I noted before, I could show you dozens of examples of baroclinic leaves in satellite imagery---they are not rare or unusual.   But if you are a meteorologist trying to find evidence of new mid-latitude cyclone, you should be on the lookout for the classic leaf signature.


September 28, 2021

Gulf of Alaska Storm Season Begins

Some of the most ferocious storms of the planet develop in our backyard:  the Gulf of Alaska.

Storms that are not hurricanes or typhoons but capable of producing winds and waves comparable to Category 3 tropical storms.

And one will occur in a few days.

The satellite imagery of these storms is remarkable, as illustrated by a powerful example from September 26, 2012.  Masses of frontal clouds swirl into the low center, not unlike water circling into a drain.  The low center is in the center of the swirl.  

The energy source of these powerful storms comes from contrasting cold and warm air, with warm southerly flow in front of the storm and cold air circling behind.  The popcorn-like, modeled cloud field south and west of the low center in the above picture indicates cold, unstable air.  This storm had plenty of fuel

The central sea-level pressure in Gulf of Alaska low centers can drop as low as 930 hPa (hectopascals, also known as millibars).   Such pressures are similar to the central pressures of major hurricanes. The strongest storms to hit the Northwest rarely get down even to 980 hPa.   

And then there are the winds.   Gulf of Alaska storms can possess gusts to 80 mph or more and sustained winds reaching 50-70 mph.   Associated ocean waves that have exceeded 100 ft.

Autumn is actually a favored time for Gulf of Alaska storms, something illustrated in these figures from a climatological study (Mesquita et al. 2010).  This figure shows the relative number of storm tracks, for each season.  The lower right is fall.  Gulf of Alaska watch out!

This Week

A very energetic Gulf of Alaska storm will form later this week.    The latest National Weather Service GFS model run, valid 11 PM Friday, shows an impressive 947 hPa low center, just south of Alaska with sustained winds reaching 64 knots.   Just achieving category 1 hurricane strength (sustained winds of 64 knots or more).


The European Center model is also going for a big storm, but a bit weaker and further to the east.

This is a rapidly intensifying storm (it was 992 hPa only 24 h before) and thus is called an atmospheric BOMB.  Atmospheric bombs must deepen by at least 24 hPa in 24 h.  This one doubles that.  Impressive.  Very impressive.

_________________________________________
Last Chance to Take My 101 Class as an ACCESS STUDENT

As I noted in previous blogs (see repeat below), I am teaching atmospheric sciences 101-- the introductory class in weather and climate-- this fall. Class starts tomorrow!

If you are over 60 and a Washington State resident you can take it as an ACCESS student for very little cost (normal fare would be around $1800).  You can attend the class in person or over zoom.

ACCESS students don't officially get registered until 3 days into the quarter, so if you are going to register, send me an email and I will send you the zoom link so you won't miss the first class.  Classes will be recorded.

Atmospheric Sciences 101

Like last year, I am teaching atmospheric sciences 101:  a general introduction to weather and climate, this fall.  You can learn more about the class on the class website.  I talk about everything from the basics of the atmosphere to weather prediction, thunderstorms, hurricanes, and local weather to global warming and climate.

I will be teaching the class in person at the UW, but will also make it available over zoom.  Thus, folks can take it remotely.

If you are over 60, you can take the class through the ACCESS program for a very nominal charge (something like $15).   Last year I had over 125 folks do so.

So if you are a UW student looking to learn about weather or a non-student interested in the topic, I welcome you to join me this fall.  My first class is on September 29th.


September 26, 2021

Heat Wave Versus Cold Wave Deaths in The U.S. and the Pacific Northwest

There have been a lot of stories about heatwave deaths this summer and the latest Washington State Department of Health (DOH) statistics indicate that the June 2021 heatwave contributed to 91 deaths.   

The DOH also noted that 39 individuals died from heat-related complications from 2015-2020.  Nearly all of those who lost their lives were either elderly or suffered from serious pre-existing conditions.

Heatwave deaths are all tragic losses and we should do all we can to prevent them, including expanded use of air conditioning, cooling centers, and more.

But it is also important to understand the other "side of the coin", about deaths resulting from cold waves, both in the Northwest and the rest of the nation.

And the facts may surprise you.  Far more people die from cold than heat.  

Furthermore, cold waves sometimes kill young people, often on icy roads.

Consider the national statistics provided by the U.S. Environmental Prediction Agency.  Based on hospital records, the death rate of coldwaves (top) is at least TWICE that of heatwaves (bottom)

Coldwaves

Heatwaves

A 2014 study by the U.S. Department of Health and Human Services found that from 2006–2010 about 2,000 U.S. residents died each year from weather-related causes  About 31% of these deaths were attributed to exposure to excessive natural heat, heatstroke, sunstroke, or all; 63% were attributed to exposure to excessive natural cold, hypothermia, or both.  

Cold was twice the threat of heat, consistent with the findings of the EPA.


And an article in the well-known medical journal, The Lancet (Gasparinni et al. 2015), took a more international perspective examining data from 384 locations in Australia, Brazil, Canada, China, Italy, Japan, South Korea, Spain, Sweden, Taiwan, Thailand, UK, and the U.S. found that cold was MUCH more of threat....by a ratio of roughly 15 to 1.

Imagine courtesy of the Lance.

I could provide more publications, but the message is clear and consistent: 

Coldwaves kill many more people than heatwaves.  

The recent Texas cold wave provides a stark example, with at least 210 losing their lives.  And here in Washington exposure under cold conditions frequently kill the homeless and even folks inside unheated homes.  I found several dozen of such deaths in the Northwest media during the past ten years alone.  And there is a proven relationship of cold contributing to cardiac deaths in our area (see here for one study)

It is clear that the threat of cold is vastly underplayed by these statistics.  Cold waves are associated with icy roadways and ice on roads is a major cause of accidents, particularly in our state.

A few years ago I checked the WA State Patrol database, finding that one to two dozen WA citizens lost their lives each year through accidents on icy roads, with hundreds being injured.  Washington DOT statistics were consistent with this.

As a young professor, I started doing forensic meteorology research, and the number one reason lawyers called me was to aid in cases with deaths on icy roads.  And for those interested in social justice issues, such icy deaths fell predominantly on more vulnerable groups, who often traveled in the early morning hours to agricultural, construction, or service jobs.


Icy road accidents, often associated with western WA snow events, often hurt the young and healthy.

Global Warming Implications

Now let me say something that is true, but unfortunately will get some folks upset.  

Since cold waves kill more people than heatwaves, global warming might well cause fewer deaths overall.  Ok, I said it.  And it is true, unfortunately, that the media, such as the Seattle Times and National Public Radio (e.g., KNKX) never mention this fact.    Heatwaves are discussed endlessly, but the harm of cold waves is ignored.  And you know why.

This is NOT to say we should ignore global warming because warming might save lives and lessen injury.   We should take prudent and economically reasonable steps to minimize warming because of other issues.  That is why I support a carbon tax, nuclear power, and the realistic use of renewables.  And we need to ensure we talk prudent adaptation steps.

But let us at least acknowledge the truth of temperature extremes and human harm.


______________________________________________

The Second Edition of My Northwest Weather Book is Now Available!

Finally, the supply chain issues have been overcome.  My new book is immensely improved over the first edition, with new chapters on the meteorology of Northwest wildfires and the weather of British Columbia.  A completely revamped chapter on the effects of global warming on our region.  And it has been brought up to date with recent weather events and the imagery is improved greatly.
 

Where can you get it?

Local bookstores, such as the University of Washington bookstore.  The UW Bookstore has just received several dozen copies.

Or Third Place Books in Lake Forest Park or Seattle.

And yes, there are online sellers like Amazon, which I understand ordered over 2000 copies.

September 24, 2021

Weather Signs over our Mountains and a Wet Week Ahead--All in My New Podcast

Weather and climate modelers like myself use a lot of technology for weather prediction, and that technology has become very capable.

But we should not forget that there is a lot of information available by simply being a good observer and my podcast will give you a prime local example:  "cap clouds" over our major mountain peaks.


Cap Cloud over Mount Hood.  Courtesy of Steve Rawley

My podcast will explain why cap clouds and lenticular clouds are often a potent sign of upcoming clouds and precipitation.

And my podcast will also supply the latest forecast, describing the warm weather today and Saturday, followed by an extended decline into clouds and rain.  The totals over the next week will be substantial, with over five inches in the Olympics, North Cascades and the mountains of southwest BC (see total below).  Wow.


You can listen to the podcast below or through your favorite podcast server.


Or access the podcast on all major services.

 HTML tutorial HTML tutorial

Like the podcast? Support on Patreon Become a Patron!


September 23, 2021

Another Wet Period Ahead

We are now enjoying a short period of relatively dry conditions before the next surge of moisture reaches our shores, starting later on Sunday.  

With the expected precipitation,  September precipitation over the region will come in way above normal.

And the recent cool, wet weather has had one positive impact:  local wildfires are rapidly declining, with MUCH less smoke apparent in satellite pictures.

Compare the NASA MODIS visible satellite imagery for Tuesday (Sept. 21) with earlier this month (Sept. 7)--see below.  A LOT more smoke two weeks ago!  And with the upcoming rain, the remaining Northwest fires will become history.

Sept. 21

Sept. 7

River levels and streamflow are generally near normal around the region, which is good for supporting local salmon runs around the region.

The Soggy Story for Next Week

    The dry conditions today through Saturday are associated with a ridge of high pressure aloft over the eastern Pacific (see below).  You can see the large high pressure/height center positioned west of California in the map for this morning at 5 AM.

That ridge weakens and moves eastward on Sunday, and by Monday morning a very strong trough of low pressure is approaching.  That means clouds and precipitation.


The latest forecast shows rain reaching northwest Washington on Sunday afternoon (the 24-h amounts ending 5 PM Sunday are shown below).  So from Tacoma south and east, Sunday afternoon will generally be dry.  


After Sunday, we will be buffeted by storm after storm.    Below is the total precipitation accumulation forecast through 5 PM Friday.   
Wow.  

Southwestern BC and northwest Washington will be hit very hard, with as much as 5-10 inches in the mountains.

The latest 6-10 day precipitation forecast of the NOAA Climate Prediction Center is consistent with this modeling.  Saturday will be a great day for outdoor activity.   Early Sunday will be ok...and then the faucet turns on.


And these wet systems will be cool enough to start the snow season at higher elevations, particularly in British Columbia.

__________________________________________________

Atmospheric Sciences 101

Like last year, I am teaching atmospheric sciences 101:  a general introduction to weather and climate, this fall.  You can learn more about the class on the class website.  I talk about everything from the basics of the atmosphere, to weather prediction, thunderstorms, hurricanes, and local weather to global warming and climate.

I will be teaching the class in person at the UW, but will also make it available over zoom.  Thus, folks can take it remotely.

If you are over 60, you can take the class through the ACCESS program for a very nominal charge (something like $15).   Last year I had over 125 folks do so.

So if you are a UW student looking to learn about weather or a non-student interested in the topic, I welcome you to join me this fall.  My first class is on September 29th.


September 21, 2021

Are Northwest Summers Getting Drier? The Truth May Surprise You.

We have had a dry spring and summer and people are concerned.  Completely understandable.

And people's discomfort and fears have been unnecessarily worsened by the incessant drumbeat in the media and some politicians that Northwest summers are been getting drier.   And they are not shy about suggesting the cause:   climate change or what was previously known as human-caused global warming.

But is this really true?  Do observations REALLY show that our region is getting progressively drier over the past decades and century?  

The facts are clear:  there is no long-term trend towards drier summers in the Northwest.  And the effects of climate change (global warming) will be very small, with some locations receiving more summer precipitation.  But as in real life, there are details and nuances that are generally not provided in the media.....let me provide them to you here.

Fact 1:  The Pacific Northwest is climatologically one of the driest locations in the U.S. during summer.

Few places in the U.S. get less precipitation during the warm season than the Northwest, with our midsummer "drought" evident in the plot below.  Eastern Washington also has its precipitation minimum during the summer.

Seattle Precipitation Climatology

As explained in my recent podcast (see below), the origin of the dry conditions is clear:  during summer, the storm-bearing jet stream moves north of us, and the cool Pacific and an east Pacific high-pressure area lessen our chances of getting thunderstorms.  Weeks or more without rain is not unusual in our region.  It is why native plants are adapted to summer droughts and our eastside forests DEPEND on wildfire to remain healthy. 


Fact 2:  There Is Little Long-Term Trend in Summer Precipitation over the Northwest

Let's start with Seattle.

Recently, the Seattle Times did a story on how Seattle was experiencing the driest summer on record.  Strangely, they published this story before the end of the summer and when a heavy rain event was in the forecast.  Like doing a story on a low-hitting baseball game in the sixth inning with known sluggers soon at-bat.  

The truth is that this summer (20 June 20-21 September) was the 24th driest summer in Seattle, considering observations going back to 1894.  Not so impressive.

Let me show you a plot of Seattle's summer precipitation prepared by Dr. Joe Zagrodnik, a recent graduate of my department and currently a scientist at WSU. The light blue bars show the summer total precipitation each year.  The black line shows an average (or smoothing) of annual summer precipitation.


You will note a few things. There are a lot of ups and down... or what is called interannual variability. This is not unexpected during a dry summer when a chance shower can make a big difference.

There is little long-term trend in Seattle's summer precipitation... the last 30 years is about the same as the early 20th century.   

You will also note some long-term ups and downs:  wetter in the 70s, drier around 1990, wetter in the early 2000s, a bit dier recently.   

What about extreme dry years in Seattle?  Is there a tendency to have more extreme dry years recently as claimed by some?   To answer this question, below is a plot showing the distribution over time of the top ten driest years in Seattle.

Wow... most of the extremely dry years were early in the 20th century and there is clearly no upward trend in extreme dry summers recently.  In fact, we seem to be having LESS extremely dry summers in Seattle.

What about the rest of Washington State?  

Let's look at the NOAA/NWS climate division data, which unfortunately is only available on a monthly basis (below).  This plot shows the July through September precipitation from 1900 through 2020 (blue line), plus a running average/smoother (red dots) to take out some of the variability.


Lots of ups and downs, but with little long-term trend.  Some periods of high and lower precipitation as in Seattle. Perhaps slightly drier in the end.

Where did the years of driest summer conditions distribute over time for Washington State?  Here is a plot of the 20 driest years for the state.  The early part of the 20th century was dry, but there are few Northwest residents old enough to remember that period.  Clearly, no long-period trend towards more extreme dry conditions.   


Climate Change and Northwest Summer Precipitation

The implications of global warming on Northwest weather/climate is an area in which I am actively working on, under support from a variety of sources (such as Amazon's Catalyst program and the National Science Foundation).  We (including Professor Salathe of UW Bothell, and UW scientists Rick Steed and Jeff Baars) are running state-of-science high-resolution simulations of the impacts of increasing greenhouse gases on our region.

Let me show you some regional climate forecasts using an unrealistically large increase of CO2 over this century (called RCP 8.5, often termed the business as usual scenario).  So the actual changes should be less than this.

Here is the difference between the late 20th century and the middle of this century in terms of June-July-August precipitation.  Small drying in the west and little change over eastern Washington.  Eastern Oregon gets wetter.

Again, keep in mind that this forecast is using a very aggressive change in CO2-undoubtedly too much.

What does the model forecast for Seattle? 

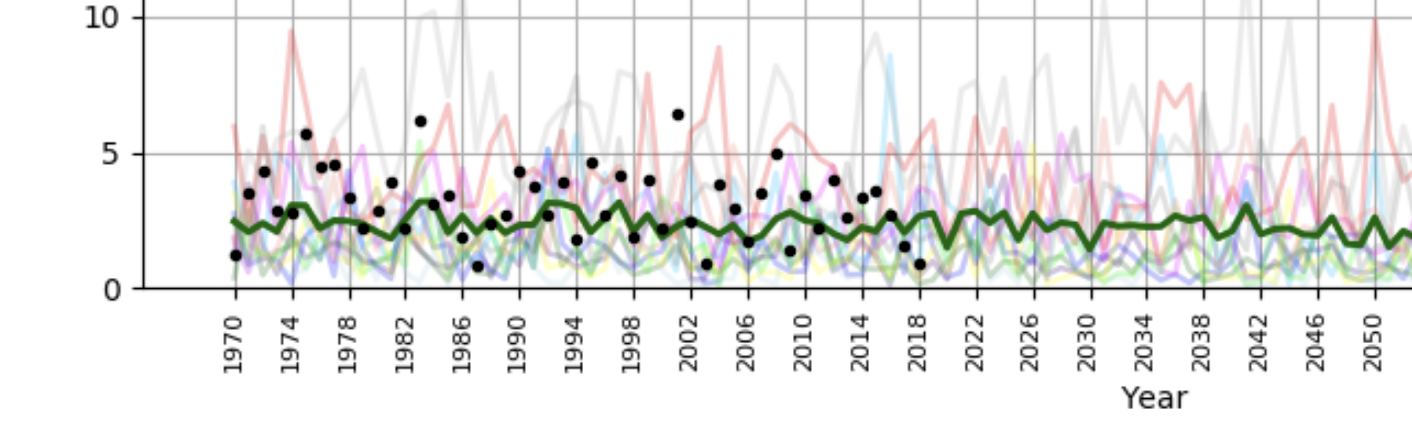
We ran an ensemble of many climate simulations starting in 1970, which are shown by the colored lines.  The average of all these forecasts is shown by the green line and observations are indicated by black dots (the y-axis shows inches of precipitation).    Not much change...just a very slight decline over time.

I could show you a dozen more of such predictions, but climate simulations provide a consistent message:   

Global warming will not change Northwest summer precipitation by much, perhaps with a very slight decline in the west that will hardly be perceptible.  And east of the Cascades might get wetter as more southwest monsoon moisture moves northward.

Now temperatures will warm slowly during this century, which will cause more evaporation, so soil moisture during summer could well decline.   But there is no abrupt, end of the world, "existential" drought threat in the offering.  

Sometimes atmospheric variability randomly gives us a very dry summer, like this year, but that is entirely natural and expected.

Any media or individuals telling you otherwise is not following the science.

September 18, 2021

Big Winds, Heavy Rain, and Now Thunderstorms

 Nearly 100,000 Washington State power customers lost power last night as strong winds first hit Northwest Washington and then spread across the remainder of the western interior as a powerful front crossed the region during the late evening.  Trees are very vulnerable to the first windstorm of the season, particularly if they are fully leafed out.


Winds gusted to around 60 mph over Northwest Washington, 40 mph over the lowlands of the South Sound, and reached 103 mph at Camp Muir on Mount Rainier.

The power outage map from Puget Sound Energy last might shows the damage, centered around NW Washington and the south Sound towards the Cascades.


Here are the top wind speeds on Friday (click to expand).  A gust to 63 mph a Whidbey Island Naval Air station, nearly the same at Port Townsend, and nearly 50 mph on the San Juans.   These winds occurred during the afternoon before the front made landfall.   


Strong winds over NW Washington are very typical for winter weather systems around here,  with the powerful winds responding to the strong pressure difference (gradient) produced downstream of the Olympics.  This is illustrated by the forecast pressure (brown lines are isobars, lines of constant pressure) and winds (color shading) at 5 PM yesterday (below).   Look carefully and you will see a large change of pressure over northern Whidbey Island....this accelerated winds from the southeast.


Over the south Sound, the winds gusted to 40-50 mph last night over the lower elevations, 70-80 mph on lower peaks, and over 100 mph on Rainier.


These winds occurred during the later evening as the strong front went through....the feature I warned about in my last blog.  The radar image at 11:11 PM last night showed a line of strong radar return with the front (the arrow shows you the feature).


The frontal winds came up very quickly and dropped very quickly, as illustrated by the winds at the USDA RAWS site in Enumclaw, southwest of Seattle.  A gust to 36 mph with the front.


And this was a particularly strong front with a VERY large temperature change associated with it.  To prove this, here are the temperatures at Enumclaw.  Temperatures rose before the front to 72F and then crashed to the lower 50s within a few hours.  Don't see that kind of large temperature changes with fronts very often around here!


Precipitation?   This system brought plenty, ranging from 4-6 inches in the mountains to around a half-inch in the rain shadowed areas.


Rivers are way up right now, with many Washington rivers above normal levels.  But no flooding because they started at below-normal to normal levels.   

Part II. Thunderstorms and showers

The excitement is not over yet!  With an upper-level trough/low approaching and cooler air moving in aloft, the atmosphere will be primed for convection and thunderstorms.  So get your lightning rods ready.

The latest visible satellite image shows the front moving through right now (the solid band of clouds) but also displays lots of convection (instability showers of cumulonimbus) offshore (these are the popcorn-appearing features).  Those showers are strong and have our names on them.  But most of you will have a break this morning and early afternoon--so have fun outside this morning if you can.


A particularly potent band will come through this afternoon and evening (see the simulated radar image at midnight tonight below).   Many of you will hear the rumblings of thunder.  And more shower action on Sunday.  

It is good to have active weather back...and I note that it is quite typical for this time of the year.

Forecast radar reflectivity at midnight tonight.


Should I Let AI Write My Blogs?

I spend a lot of time thinking about and writing my blogs.   Could AI apps do the work for me?   Could any of you tell the difference? Well,...