November 29, 2016

Will Snow Hit the Puget Sound Lowlands in a Few Days?

Some of the media have already started to talk about it: the possibility for much colder temperatures and lowland snow during the Sunday through Tuesday period.

Let's analyze the possibilities, making use of the most powerful probabilistic forecasting tools at our disposal.  We will attempt to avoid the problems experienced during the October 15th storm by highlighting the forecast uncertainties and the use of ensembles.

Snow Forecasting is HARD

Let me begin by noting a key point:  it is difficult to get lowland snow around Puget Sound because the Pacific Ocean and Puget Sound are relatively warm (around 50F).  It is easy for us to be mild and wet and frequently we are cool and dry.  But to be cool and wet is very hard, demanding a rare configuration of pressure and winds.  As a result,  snow is the most difficult forecast problem in our area.


As I have mentioned frequently, all forecasts should be probabilistic and the most potent tool to create probabilities and to determine uncertainty is through the use of ensemble forecasts--running weather models many times with different initial states and model physics (e.g., moist processes).

So let's look at some ensembles!  We can start with the NOAA/NWS GEFs ensemble of 21 members (relatively coarse 35 km grid spacing) for snow over the next week (see below).  Dates/times are in UTC/Z, the average of all the ensemble members (the ensemble mean) is shown in dark black, the individual ensemble members are in light gray, and the blue line is single high-resolution (13 km)  GFS forecast.

Note that the ensemble mean shows about 1.5 inches by 4 AM Monday (12Z, 5 December) and there is considerable spread (from 6 inches to 0).   Most members produce 1-4 inches.  The high-resolution run is very different, with no snow until later in the week.

Next, lets examine the snow forecast of the best global ensemble system in the world (the European Center) using the wonderful WeatherBell web site. The European Center (EC) ensemble is larger (51 members) and higher resolution (25 km) than the US version.  The graphic below will take some getting used to.

The top panel shows the accumulated snowfall for each ensemble member for Seattle. Note that most members show snow starting on Sunday or Monday (Dec 4th or 5th) and several members show much more snow later in the week (8th or 9th).

The bottom panel shows the ensemble mean (green) and the high resolution snow forecast (deterministic, blue) for Seattle.   The ensemble average shows some very light snow on Sunday and Monday (maybe a half inch), but more more later in the week (with total accumulation of a few inches).  The much higher resolution deterministic run (single 9-km grid spacing run) shows more snow (3-4 inches).

What about temperature in Seattle?  Here are the ensemble forecasts for high and low temperatures from the EC model.  The single high resolution forecast is black, the ensemble mean is green, and the range of the forecasts are shown by the blue "whiskers".   The rectangles encompass the 50% of forecasts closest to the mean.

The big story....a major cool down, with daily highs dropping from 46-47F to around 40 F on Monday.  Even lower after that.  After around 200 h, the uncertainty becomes very, very large.


So based on the ensembles, I feel pretty confident to forecast much cooler temperatures next week.  And the ensembles suggest a good chance of getting at least a dusting early next week, with more later.

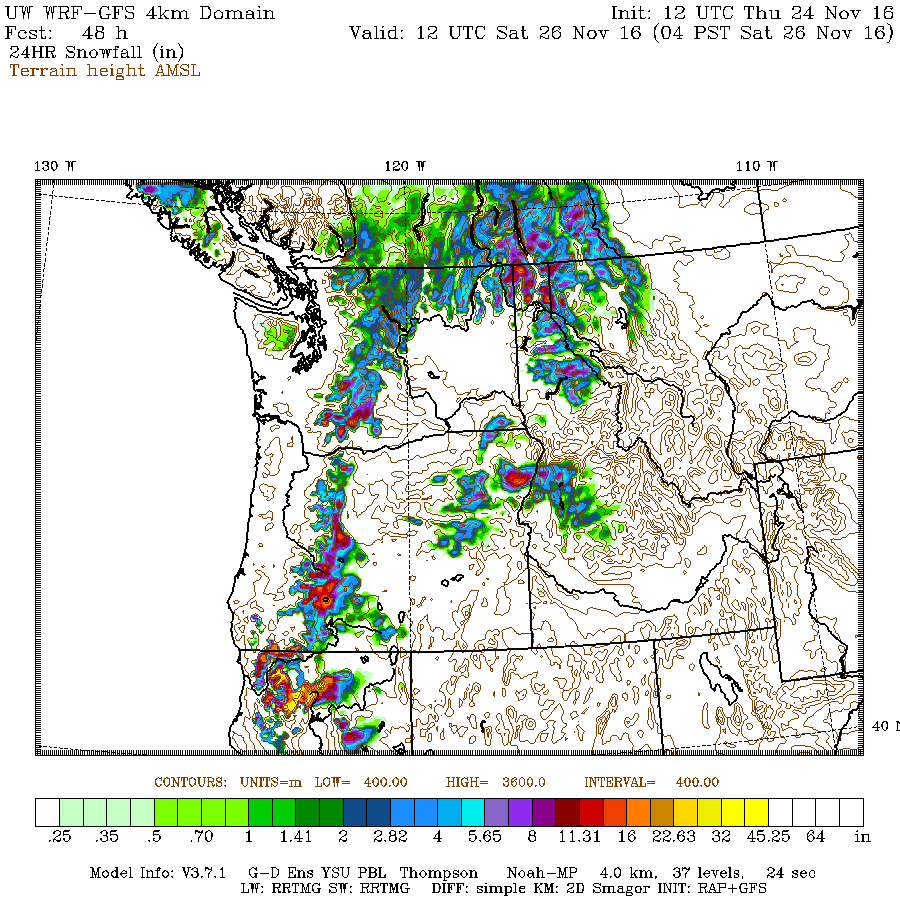
Finally, with all that I have said about uncertainty, lets look the latest UW high-resolution run, which is driven by the high-resolution NOAA/NWS GFS model.

On Sunday at 1 AM, a very strong Pacific cold front is pushing southward over NW Oregon, with cold temperatures behind.


By 4 AM Monday, cold air (blue/purple/white colors) had spread over our region.

By 1 PM Monday, a low-center had formed just off of the SW WA coast-- this is getting close to a typical snow pattern for Puget Sound.

The 24h total now forecasts ending 4 AM Sunday indicates LOTS of snow over the WA Cascades (skier will rejoice)
The subsequent 24 h brings lowland snow, mainly over SW WA and western Oregon.  But the uncertainty is very large, so be prepared for the details to change.


Bottom line of the above:  there is a high probability that we will see substantially colder temperatures over the region starting Sunday.   It is probable but not certain that there will be some light snow at lower elevation on Monday (with the potential for more in some locations).   There is a good chance of heavier snow (a few inches) later in the week.  At this point, the ensemble don't indicate a major regional low level snow.    The mountains will get large amounts of snow, including the lower passes.

November 28, 2016

Why Does Mount Baker Get So Much Snow?

Mount Baker Ski area, located in the northern Washington Cascades (see map below), is a fabled


location for large amounts of snow.  For example, it holds the U.S. record for annual snowfall (1140 inches).


And today, the Mount Baker Ski Area website is claiming that they have more snow than any other ski facility in the entire U.S.!  With 83 inches at 5000 ft!


Are these Trumparian claims?  Is Mount Baker really that snow bound?  And if so, why are they so endowed with the white stuff?

A glance at the snow depth analysis from the NOAA National Hydrological Center shows that the greatest snow depths (darker blues and purples)  today are clearly over our part of the country,
A closer view shows heaviest snow around the volcanic peaks, the north Cascades and the Olympics.
The Hurricane Ridge ski area in the Olympics is not open yet, so I think that the Mount Baker ski area has reason to crow that they are tops in the U.S. right now.  And the all-time record was pronounced by an official arm of the U.S. government, so I am certainly not in a position to dispute their findings.


So what is it about Mount Baker ski area that gives it so much snow?  It is really not that high, with most of the ski runs between 4000 and 5000 ft.   Folks in Colorado or the Sierra would laugh at such low elevations.

But Mount Baker and much of the Cascades start with a big advantage:  lots of moisture and precipitation.  The western slopes and crests of the Northwest mountains are the wettest locations in the U.S. due to the persistent winter storms passing over the region in winter and the great enhancement by the regional terrain (see annual climatological precipitation maps below).

The north Cascades are not as wet as the western side of the Olympics, but are far enough to the northeast of the Olympics  that they escape much of the Olympic rain shadow. Furthermore, the terrain around Mount Baker extends more westward than the bulk of the nearby Cascades and has more of a NW-SE orientation, providing more uplift to the frequent southerly/southwesterly flow of the region.

Thus, with many incoming storms and moist air off the Pacific moving up the terrain (and thus cooling, saturating, and then precipitating), moisture is no problem.   The best supply in the U.S.

And there is not much high terrain upstream of Baker for the typical southwesterly winter flow;  there there is less competition for the incoming moisture.

But then there is the issue of temperature...the air must be cold enough to snow. That average freezing level (or melting level) of the air coming into our region (as observed at the Quillayute radiosonde site) is shown by the graphic below (from the wonderful NOAA/NWS Storm Prediction Center website).  On average, the freezing level is near 4000 ft.  And keep in mind that snow does not melt immediately at freezing...the snow level (where all the snow is melted) is about 1000 ft below the freezing (or melting) level.


So Baker is just high enough to get reliable snow.  And, of course, being in the northern part of Cascades makes it cooler than, say, central Oregon.

 But there is something else.   The amount of snow is enhanced for temperatures just below freezing, because the amount of moisture that air can hold (and thus precipitate) is greatest for warmest temperatures.   You can get heavier snowfalls in general for temperatures between 27 and 32F then 15 and 20F.    So Baker is at the perfect altitude range for maximum snow.  To put it another way, a ski are at 4000-5000 ft gets more snow than at 6000-7000 ft with an average 4000 ft freezing level.

Lots of moisture, great exposure to incoming flow, orographic/upslope precipitation enhancement, and perfect elevation range for the observed freezing level come to together for an optimum environment for lots of snow.

Finally, let's end this blog by looking at the snowfall and accumulation at  the Baker observing site maintained by the Northwest Avalanche Center.  The top figure shows 24h snowfall and the bottom,  snow depth.  About 65 inches at Baker, with the big dumps on Nov 24th and 25th.


More is coming.

November 26, 2016

Wet and Warm Thanksgiving Weekend After Large Amounts of High-Elevation Snow

The Thanksgiving has been generally wet and warm, but with large amounts of snow at higher elevations.  The temperatures at Seattle-Tacoma Airport and Stampede Pass (4000 ft) in the Cascades, tells the story (red and blue lines are average highs and lows this time of the year).   Minimum temperatures have been way above normal at both locations.  As I have noted in several blogs, this warmth is due to a persistent area of low pressure off our coast, which has brought in warmth and moisture.

The precipitation over the past day (24h ending 11 AM Saturday) has been impressive over the southern Olympics,  and north Cascades (2-3 inches in places).  You will note a profound rain shadow NE of the Olympics with only .07 inches over northern Whidbey Island (Ebey's Landing is one of my favorite winter walks).


The past seven days has been VERY wet along the coast, with some locations along the slopes of the Olympics and coast coastal mountains getting 10-20 inches)---see left panel below.  The right panel shows the difference from normal for the same period--unusually wet coast.  Some of the coastal river have hit or approached flood stage.

On Thursday and Friday, it was cool enough (and certainly wet enough) that the higher Cascades (above roughly 4000-4500 ft) got hit with several feet of snow (like three feet at Mount Baker ski area).  But it was too warm for the lower ski areas (and particularly Snoqualmie) to get anything on their lower slopes.

And it was made worse last night, when a warm front came through, pushing the snow level up to around 5000 ft.  The time-height cross section above Seattle shows this clearly (red is temperature in C, blue wind barbs, ordinate is pressure (850 is about 5000 ft), and time increases to the left (in UTC)


A weak frontal zone is now draped over the Northwest coast with light to moderate precipitation  (see radar below)
As the day goes on the front will slip eastward with precipitation stopping and the air cooling aloft.

Sunday morning will be a good time for outdoor activities (or to take part in the Seattle marathon) or to get across the passes.   Later Sunday, a strong (but cooler) frontal system will move in and will it should be raining over the lowland by dinner time.

November 24, 2016

Turkey and Mountain Snow

They are always a good combination:  mountain snow and turkey.  And this year we will have both of them.


During the past two days, there has been modest snow (1-12 inches) in the mountains, with a snow level of 3000-3500 ft, but this is going to rev up over the next 24 hours. The lower passes Snoqualmie and Stevens are slushy and some ski areas (e.g., Whistler, see below) are now open.


But the best is yet to come.  The latest infrared satellite image show that a wet, but relatively warm, frontal band is now over western Washington, but a cold trough, with convective instability showers, is close behind.  At the front goes through later today, winds will turn more westerly (resulting in enhanced upslope precipitation on the Cascades) and cooler (with lowering snow levels).


The latest UW WRF model run, showing 24-h snow ending 4 AM Friday, suggest large amounts on and near the high volcanic peaks (3 feet +), and 1 foot or more over much of the terrain above approximately 4000 ft).  The biggest issue is the temperature:  the air mass is still relatively warm, so that below about 3500 ft there will be a transition to a rain/snow mix.


As a result, Snoqualmie Pass is predicted to receive far less snow than higher elevations, which is good for all those traveling to eastern WA.  Stevens Pass, another 1000 ft higher, will get more snow and will be more treacherous.   It is uncertain whether they will get enough to open--but it will be close.

On Friday, we will experience some post-frontal showers, with the heaviest snow moving southward to southern Oregon and N. California (see below).   Around the lowlands of western Wa/Oregon, Friday will be a relatively dry day with moderate temperatures (about 50F for a high).  Perfect for a post-Thanksgiving walk or ....if you can't avoid it.... do some Black Friday shopping.


Now I should not be too fixated on snow.   We have been receiving a lot of rain recently, with the last 24 hours bringing 2-3 inches over the coastal mountains.  Our regional reservoirs are filling very rapidly and are now about 1 month ahead of normal in terms of their levels.


This year is shaping up to be a total drought-breaker in California and during the next few days the jet stream will be streaming into southern Cal., bring unseasonal rain and snow.  Then a HUGE ridge of high pressure builds over the eastern Pacific (see upper level map for 7 AM Monday),  allowing some weak disturbances to hit our region and the end of all heavy precipitation.


Finally, I should note that the Northwest Avalanche Center begins their daily avalanche forecasting today.  I can't say enough positive things about these folks.  Experts in mountain weather and avalanche prediction, their forecasts are not only excellent, but their site also has a lot of invaluable observational data (e.g., snow depth).  If you are going up to the mountains, check their website and considering donating to their operation if you find it valuable.


Have a good Thanksgiving!

November 22, 2016

Heavy Mountain Snows Ahead

Update at the end!

There are going to be some happy skiers, snow shoe enthusiasts, and snow lovers this weekend, because quite a bit of snow is going to fall above 3000-3500 ft during the next week.  A combination of a series of wet systems and temperatures just cold enough for mountain snows will result in several feet of fresh snow at higher elevations.

The infrared satellite image this morning looks promising.  A modest frontal band, associated with a band of rain at lower levels, is now crossing the coast.  But that is not what has gotten me excited...it is what is offshore:  a broad region of instability (the mottled broken clouds) that is associated with cold air over warmer water.   These kind of cold convective showers are the big snow makers of our region.


Let me show you some model output for the next week--and keep in mind there is always uncertainty in the forecast.   However, this kind of general pattern is far more predictable than the exact path of a small low center.

I will start with the total snow accumulation (snowfall) for the next week of the European Center Model (graphics courtesy of WeatherBell).  Wow.   The Cascades, the Sierra, the Olympics, and the Mountains of southern BC get three feet or more above roughly 4,000 ft.

 A close up of NW Washington shows the promising situation more clearly.


 How about our higher-resolution UW WRF, driven by a completely different global model (the NOAA/NWS GFS)?  Here are the 72h totals (ending 4 PM Friday).  Huge amounts (3+ feet) in the Olympics and southern BC mountains.  Much of the WA Cascades does well.  But far less in Snoqualmie Pass (4-5 inches)--which is good considering how many people will be crossing over I90 for Thanksgiving.


For the next 72 hr, as the jet stream sags southward, the snow action shift shifts towards Oregon and California, with nearly a yard of snow falling from the south Cascades to the Sierra.


The large scale upper level pattern for 4 AM Monday has a La Nina look with broad northwesterly flow over the Northwest and high pressure offshore.  Radically different than the pattern of the last month, with a deep trough over the NE Pacific..  For the sake of mountain snow lovers, lets hope it holds.

__________
Update:   Here is the 72h snowfall from the latest UW WRF run at ultra-high resolution (4/3 km) for western WA.  Some places in the Olympics get over 40 inches, as does Mt. Baker and Rainier.  Low and warm Snoqualime Pass does poorly (only a few inches).     I suspect Baker will get enough to open.


November 20, 2016

A Revolutionary New U.S. Weather Satellite is Launched: GOES-R

The meteorological community (and U.S. taxpayers) enjoyed a sigh of relief as the newest U.S. weather satellite was successfully launched from Kennedy Space Flight Center last night at 6:42 PM EST.

As I will describe below, this satellite not only continues the critical functions of the satellite it replaces, but brings new capabilities that promise to improve global and regional weather prediction.

But such capabilities don't come cheap:  the cost of this satellites and its three subsequent siblings is in the billions of dollars.


GOES-R is a geostationary weather satellite, positioned in a very special orbit over the equator at 22, 300 miles above the equator.  In such a geosynchronous orbit,  weather satellites can view the same portion of the earth continuously (it rotates around with the earth).  By the way, GOES stands for Geostationary Operational Environmental Satellite.

 There are five operational geostationary weather satellites today, two launched by the U.S., one by Europe (Meteosat), one by India (INSAT), and one by Japan (GMS).  Together, this satellite provide total world coverage, except for the polar regions.


But  don't worry, we have coverage there as well from another class of weather satellites called polar orbiters that have a distinctly different orbit.  Polar orbiters generally fly very low (800-1000 km above the surface) and allow the earth to rotate under them.

Between the geostationary and polar-orbiting satellites, meteorologists have total and continuous view of all weather features of our planet.   It is impossible for major storms to hit a coast without warning, unlike the situation before weather satellites (the first weather satellite, TIROS-1, was launched in 1970.  The first geostationary weather satellite in 1975).

It should not be forgotten that the two major technologies behind operational weather forecasting is numerical weather prediction and weather satellites. Weather satellites provide over 95% of the information used to describe the atmosphere, the first step in numerical weather prediction.  There are no weather data voids over our planet now..and you can thank weather satellites for that.

So why is GOES-R such an advance?

First, it has a new imager (the Advanced Baseline Imager, ABI), with half the pixel size of previous geostationary satellites.   Thus, visible imagery can see 1/2 km details compared to 1 km of the past satellites.  It is like going from old analog TVs to high definition.  A Japanese weather satellite already has the new imager, here is an example of the wonderful clarity of the ABI imagery:

If you look closely, you can see something else....the image is in color!

The current U.S. satellites only can produce black and white imagery in the visible, but ABI observes the earth in three times more wavelengths, allowing the production of color visible images.

The new satellite can also scan much faster, giving new images more frequently.  Today we get a new image over the U.S. every 15 minutes.  With GOES-R that will decrease to every 5 minutes.    More frequent imagery allows forecasts to follow rapidly changing weather situations (e.g., thunderstorms) and thus provide better forecasts.

But I am particularly excited about a brand new capability of GOES-R, the ability to see lightning from space.   This is made possible by a new sensor, the Geostationary Lightning Mapper, which uses optical sensors to view lightning flashes from space.  There are lightning maps today from surface-based sensors that measure the electronmagnetic pulses from lightning.  Unfortunately, these sensors mainly observe lightning strikes between cloud to ground and not cloud to cloud.  They also have problems sensing lightning in distant areas or in the middle of oceans. In contrast, GOES-R will observe all lightning flashes.


Lightning observations are very valuable data, providing important information about the structures of the atmosphere.  For example, a lightning flash suggests that the atmospheric volume is saturated, the vertical structure is unstable, and that there is ice within the clouds.   This information can be used to improve our description of the atmosphere and subsequent forecasts.   For example, I received some NOAA GOES-R research funding to study the implications of lightning for improving numerical weather prediction over the US.   The results were quite positive.

GOES-R also has new sensors for studying the sun, including an ultraviolet radiation imager (see graphics).  These sun sensor will aid in forecasting solar storms that can greatly affect communication.

I have touched upon just a few of the the impressive capabilities of the new NOAA/NWS GOES-R satellite, which be entering its final orbit and start the testing phase during the next few weeks.

Should I Let AI Write My Blogs?

I spend a lot of time thinking about and writing my blogs.   Could AI apps do the work for me?   Could any of you tell the difference? Well,...