December 31, 2020

National Weather Service Weather Radar Disaster

There are few more important weather data sets collected by the National Weather Service than weather radar.


  • It shows where it is raining/snowing and how those areas are moving.
  • It tells us about severe weather, such as intense, rotating thunderstorms.
  • It even tells us about bird migration and how the winds are moving.

Critical, important information that saves lives and greatly improves weather prediction.  And information that allows us to stay dry and enjoy outdoor activities.

To give us this boon, the National Weather Service spent over 3.1 BILLION dollars to install 122 Doppler weather radars across the country (see below for the network).  They have spent hundreds of millions of dollars to maintain this complex system.


To view the weather radar data, one previously had a variety of options.  You could go to the National Weather Service web site, where there was a serviceable but degraded resolution interface (see below), visit university of private sector websites,  or you could purchase/acquire a radar app for your smartphone, which (to be honest) is what most professional meteorologists do.


But now the problem.

The clunky, but workable, old National Weather Service radar displays depended on Adobe Flash to work and Flash would no longer be supported after 2020.   So they came up with a replacement.  

And the replacement is a disaster--essentially non-functional.   It either fails to bring up the radar imagery or does it so slowly to be useless.   You can find it here: https://radar.weather.gov/#/  

Try loading it and animating an image (the key function that everyone needs).   You will immediately see the problem.


The negative reaction regarding this inoperative radar web site has been substantial, including an article in the Washington Post and a tsunami of negative comments in social media.

Software engineering has never been a strong suit of the National Weather Service and they have had problems on their online weather web sites for year and software issues have plagued their numerical weather prediction efforts for decades.   Even today, local National Weather Service offices lack sufficient communication bandwidth to secure all the high-resolution weather products they could use profitably.

Recently, the National Weather Service, crippled by lack of an ability to get data out to the national community, has started to restrict access to their servers, a move that could undermine the use of its model data by the private sector (including major weather companies like IBM/WeatherChannel, Accuweather, and others).

A key issue is that the National Weather Service insists on using early century data distribution technology, using their own servers for national distribution of large data sets.

The solution to the National Weather Service data problem is obvious, particularly to the technologically inclined among this blog's readers: make use of cloud distribution of the weather radar and other large data sets.

It turns out that the National Weather Service is ALREADY moving the FULL weather radar data set in REAL TIME to Amazon Cloud Services. The radar data is already there (see below, NEXRAD is the radar data).


So instead of distributing radar data through their own servers, the National Weather Service should have their radar web site hosted in the "cloud", where the data is already resident.  

A modern approach that would afford essentially instantaneous access to the vast NWS radar data set.  The same is true of the other important data sets created by the National Weather Service (such as forecast model and weather satellite information).

So for those of you looking for weather radar data, what can you do?


Or if you want national radar information, try out the NOAA/NWS Aviation Center radar site.

Another possibility is the College of DuPage radar site.

For me, a good weather radar app is the key and the one I used is Radarscope (see below).   Inexpensive and very easy to use, and available for both Android and iPhone.  Plus you get access to the most high-resolution data.


The deeper question, of course, is how National Weather Service management missed such an obvious failure mode and why the National Weather Service software engineering and modeling has been allowed to fall well behind the state-of-the-art.  

Perhaps it is time for a private sector Weather-X.  But that should be a subject of another blog.

_________________

I will do a new weather podcast tomorrow!  The New Year forecast, plus I will explain, why there are wind gusts.


December 29, 2020

Aloha Moisture Approaching the Northwest

There are many wonderful imports we enjoy from the Hawaiian Islands, from Kona coffee and macadamia nuts, to music and wonderful foods.   

But during the next fews days, we will enjoy the imports in a more visceral, direct sense, as moisture streams to us from southwest.

The satellite moisture imagery this afternoon shows the a plume of enhanced water vapor (lighter shades) direct from the big island to the Northwest.


And as this moisture moves into us, it will be lifted by two mechanisms that will convert the water vapor into precipitation.    

The first is obvious: our substantial terrain, which forces air in the lower atmosphere to be pushed upwards, cooling as it rises, and thus converting the water vapor into rain and snow (cool air can "hold" less water vapor than warm air and thus some of the moisture condenses out).   The second source of upward motion is a potent upper level disturbance that is moving it (see 500 hPa upper level (about 18,000 ft) map below for tomorrow morning at 7 AM). The low just offshore is what I am talking about.


The precipitation will be bountiful for us.  Here is the forecast for the next 48 h.  Up to about 5 inches in the higher reaches of the Olympics, with nearly comparable amounts in the north Cascades and mountains of Vancouver Island.


And a close up view of western Washington for the same period really illustrates the HUGE precipitation contrasts of our region, with roughly 5 inches on the upper, west-facing slopes of the Olympics, but only about a tenth of an inch around Port Townsend and Sequim.  A factor of FIFTY.


There is plenty more where this is coming from, with an active period expected over the next week.  In fact, the total precipitation over the next week may reach 10 inches in places on the upper slopes of some of our region terrain.


A number of our local rivers will rise to near bank-full (yellow colors, see forecast from the NOAA/NWS River Forecast Center below) over the next few days, but at this point no major flooding is expected.


Snowfall?   There will be plenty, particularly with a series of cool/wet systems expected to hit us during the next week (see below).  At least three feet in the higher terrain of the Cascades and BC Coast Mountains.  Lots of snow over eastern WA.


Just good news for water resources.  It is what we depend on for all our water needs in the region.

December 27, 2020

The January Snow Outlook

As we pass the holiday period, we naturally think about snow.... in the mountains and near the surface....particularly considering this is a La Nina year, which tends to arc cold and wet after January 1st here in the Northwest.

The current snowpack over our region is very much near normal (see below), so ski areas and water resources are in decent shape at this point.


But as I noted in earlier blogs, we are now in a moderate La Nina, with the tropical Pacific cooler than normal (see plot of temperature anomaly from normal below).  Blue indicates cooler than normal.


Turning to the most skillful extended forecasting system--the European Center weekly predictions, it is going for cooler than normal conditions during the next 46 days (through 8 February) over the region.  Good for snow.


And the precipitation prediction (again, difference from normal) for the same period shows wetter than normal conditions over Washington and Oregon (see below).    That, again, is good for our snowpack.  

An issue of concern, and one quite typical of La Nina years, is that California will be drier than normal.  Is certainly an issue for wildfires over the Golden State next summer/fall if it verifies.   


Turning to the the one-week snow totals from the UW system--- close enough in time that we have some confidence in the predictions-- there are huge amounts in southern BC and the north Cascades, with a decent snowfall down into Oregon.  But not California.


At this point, there is no suggestion of the type of situation that would bring lowland snow to western Washington, and certainly nothing like the crazy superfront snow of past week.  That event was extraordinary is so many ways:  snow on a a day with a high temperature record, record daily rainfall, huge temperature drops, eastern WA windstorms, and so much more.

But it was extraordinary in another way.  Our numerical weather prediction models nailed it.  Several (un-named) forecasters dismissed the predictions (not this blog!) and did not communicate them to the public. 

We simply could not have provided such forecasts a decade ago.   


December 25, 2020

Solstice Wind Storm in Leavenworth, Washington

 While western Washington residents were amazed by the extreme weather of December 21, including snow, heavy rain, flooding, record temperatures and more, another extreme event struck the eastern slopes of the Cascades near Leavenworth, resulting in very strong winds, downed trees, and power outages for over a thousand customers.  The picture below provides a sample of the bedlam.

Picture courtesy of Heather Murphy and Don Schaechtel 

The cause of the eastern Washington destruction? The same as in the west. A very strong cold front.

The eastern slopes of the Cascades have been the scene of extraordinarily powerful downslope windstorms on several occasions as strong westerly (from the west) flow accelerated down into the Columbia Basin.  A famous event occurred in 1974 when a number of train cars were derailed and fell into the Columbia River near Vantage.


On Monday evening, strong winds from the west followed the passage of the powerful cold front, with a large pressure difference (gradient) developing over the Cascades (see surface weather map at sea level pressure, winds, and temperature).


A map of observed maximum wind gusts on Monday around Leavenworth (red oval) on Monday shows a 52 mph gust just east of town, 79 mph at Alpental Summit, and 100 mph at Mission Ridge ski area.  Clearly, the observing network is not dense enough to spotlight all the strong wind areas.


The Mission Ridge Summit (6730 ft) winds are shown in more detail below, with the shading indicating the range of winds at any time.  100 mph is evident, as is the extreme gustiness of the wind speeds.  Strongest winds were from the northwest (270 indicates winds from from the west).


The UW high resolution model  maximum gust forecast (in knots) for 10 PM Monday shows how structured and localized the strong winds were. Powerful winds  (blue, orange and red colors).west of Leavenworth where the terrain descends downward quickly.  Since the graphics shown are from an 18-h forecast, it was clear that some warning could have been given.


You will also  notice a large area of strong winds near Vantage (blue colors) and mega winds around the summit of Mount Rainier.  

The complex wind patterns around the Northwest make the meteorology challenging but our high-resolution models give us a powerful tool for providing localized warnings.

December 23, 2020

Frost and Freezing Fog: Drive/Walk Carefully

 We a moist lower atmosphere, a cool air mass over the region, and relatively clear skies (which allows good cooling to space),  we had good conditions for frost and fog across the region.

So be careful this morning.   Fog and freezing temperatures are the most dangerous combination, capable of laying down a thick layer of ice on cold roadways.

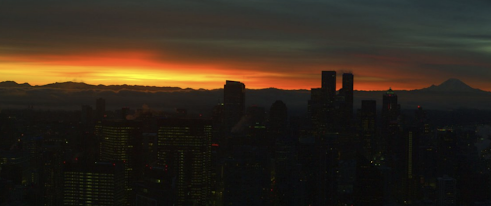
But first:  the sunrise.  It is spectacular this AM, with a poor sample from a cam this morning.


Surface air temperatures dropped to below freezing over much of the state this AM (see below, click on image to enlarge), with near 0F numbers in really cold locations (like Mazama to Winthrop).

And never forget the differences around our region, with temperatures near the water above freezing, but well below freezing in the interior (e.g., Woodinville, Duvall)

For road safety, the temperature of the road surface is what counts and that temperature can be VERY different than the temperatures of the air, which is measured 2-meters above the surface.  In fact, air temperatures at 2-m can be 3-6F cooler than at the surface under strong inversion conditions.

Consider this morning.   Below is the latest (7AM) graphic of surface air temperatures and road temperatures (in boxes) from the City of Seattle SNOWWATCH web site.   A lot of below freezing air temperatures, with warmer temperatures near the water.  But there is a lot of variability in the road temperatures.

Road temperatures on bridges, like the University of Washington viaduct (30F) are below freezing-- a real icing threat if the city did not pretreat the surface.   In contrast, road sensors in contact with the ground (e.g. West Seattle, 40F) are "toasty."    Heat is transferred up to roadway surfaces when they are in contact with the earth.....and that warming is particularly significant if temperatures have been mild (and they have been).


Again, be particularly careful if temperatures are cold and fog is around, something that is occurring right now over the south Sound area.  Here are a few shots of WSDOT cams south of Olympia this morning.   THIS is exactly the kind of situation you should fear.  If you see such conditions, slow down and be particularly careful around turns.


Finally, a final sunrise picture from WSDOT:


December 21, 2020

Now a Serious Flooding Threat in Central Puget Sound

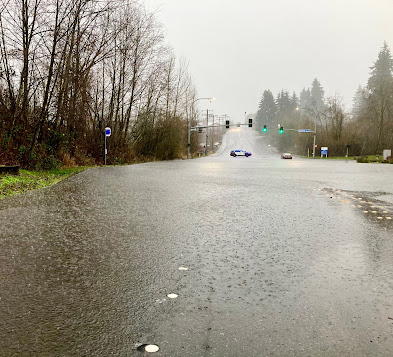
 The intense front has bogged down over central Puget Sound and very heavy rain is causing serious flooding.  

The latest one-hour radar-based precipitation estimate (ending 3:11 PM) shows 3/4 inches in that period/


The National Weather Service has a flood warning out now for central Puget Sound.  A number of roads are flooding, particularly at dips and valleys.


And here is an amazing video by Joe Zagrodnik of water jetting out of manhole covers:


And look what happened in Lynnwood:

Be careful not to drive through deep water.

This reminds me a bit of the 2006 event that led to the tragic death of a woman in the Madison Valley in her basement.  After that event, Seattle supported the development of a protective system:  RainWatch--the brought together radar and rain gauge information, plus the best model forecasts.   Unfortunately, the city decided to defund RainWatch, so the warnings it would have provided of this event are not available to city managers.


Superfront Brings Snow to Western Washington in Unusual Conditions

 It is snowing around Northwest Washington....from the northern Olympic Peninsula, to Victoria and the San Juans to Whatcom County....and central Puget Sound is next.

And you can thanks an extraordinarily strong front for the white action.  This is very good example of how precipitation intensity can bring the snow level down to the surface when temperatures are right on the edge for snow.

But first some pictures to "warm up".

Here is a snowy scene near Bellingham from a WSDOT cam looking at I5.


And definitely some snow around the Peace Arch near the international border.


Plenty of snow at the WSDOT site on the northwest Olympic Peninsula


And there are many reports of snow around Port Angeles...some folks have an inch already.
            Picture courtesy of Rick Sistek in Port Angeles    

An extraordinarily strong front is moving through the region right now with an INTENSE temperature gradient and driving rain.   Rain is hitting my windows in waves and there is practically no visibility.  My little dog is getting scared from it.  

Here is the latest radar image (from Radarscope).  Wow.   Red is intense rain...and I can assure you I am observing that right now.


There is an extraordinary temperature change across is front.   As it crossed the WA coast near Forks, there was first a warm frontal passage (temperatures zoomed up) and then as the front went through the bottom dropped out.  

And now it is happened here in Seattle.  I can't believe this is happening....the temperatures are dropping so rapidly the windows in my office are clouding up....I have never seen this (see image).


And look at the observations on the roof of my building (below).  During the past few minutes, as the winds switched from southerly to northerly, the temperatures dropped from around 14 C (57 F) to 5 C ( 41F)...and it is still dropping.  You just don't see that around here very often.


An hour-old map shows the contrast: 56 F a the UW, but 41F near Edmonds...with a 180 degree difference in direction.  Impressive.


The last NOAA HRRR forecast for total snowfall by 8 PM tonight is shown below:


Even near sea level, some wet snow could well mix in.   But I must stress that snow accumulation will be much less, particularly since temperatures are so warm.  Here is the predicted snow depth at the same time.


Anyway, a really exciting situation.  And keep in mind that only because intensity is high--resulting in mega cooling from melting and evaporation, is snow able to get to near the surface for these marginal temperatures.

Thank the superfront.


December 20, 2020

The Upcoming Lowland Snow Event on Monday

Many of you  in western Washington are going to see snowflakes tomorrow.  

But there is going to a huge variation from flurries to several inches.

The mountains and foothills are going to get hit hard and the snow-level will be low.

This is a very complex, marginal event with the potential for some surprises.   But like the COVID-19 vaccines, scientists/forecasts have better tools than even a few years ago.

Not this much.

Before I go into detail, let me give you the bottom line for the Monday snow situation.   

Temperatures will be marginal for snow, but where there is sufficient precipitation, snow will reach the surface. The northeast Olympic Peninsula will be hit hard by 2-12 inches and snow will increase to several inches quickly in the Cascade foothills. Elevations above 200 ft and away from the water could get a dusting to an inch. 

 There is the potential threat of a localized convergence zone that could set up in central Puget Sound that could lay down several inches.

The situation

The models are all pretty much in agreement about the key aspects of the weather pattern tomorrow. 

 As shown in the surface weather forecast for Monday at 7 AM, a low pressure center will reach the central WA coast at that time (the solid lines are isobars, lines of constant pressure).  The shading shows low-level temps, indicating cool air (blue) to the north and northwest.  Low level winds are also displayed.  This pattern will allow a surge of cooler air to push through the Fraser River Valley and jet southward into the Olympics, producing an upslope snow band.


The low center will then push across the Cascades and cool air will move southward behind it.  Marginal for snow near the water and where precipitation intensities are light.  And sometime dangerous could happen at the leading edge of the southward-bound cool air within the Sound.

Let me show you the accumulated SNOWFALL from the UW WRF.  SNOWDEPTH will be MUCH LESS because the ground is warm.

Here is the total snowfall from this morning through 7AM tomorrow.  At this point, northeasterly winds approaching the Olympics have started the snow event there.


By 1 PM,  the northeast Olympics slopes have been hit hard, with up to a foot back from the water.  If you live in Port Angeles or Sequim, be ready for this, particularly if you live away from the Strait.  More moderate snow (dusting to an inch) could fall over the San Juans and around Bellingham.


And now it becomes showtime for Puget Sound. 

Cooler, northerly (from the north) air will move southward into western Washington and air aloft will turn to the northwest.  Cool, upslope flow will drive the freezing level down over the Cascade foothills, with several inches of snow down to around 750-1000 ft and perhaps a bit lower. Very light snow will extend towards the Sound, but switch mainly to rain near the water and sea level.   The snow total map through 7 PM shows the situation.


But here is a danger here, one that some recent model simulations have suggested.  

That if a convergence zone sets up between the northerlies moving down the Sound and southerlies coming around the Olympics, a snowband--dropping several inches-- could set up.   Here is an example of it from the latest NWS GFS model for the 6-h snowfall ending 7 PM tomorrow.  I will be watching the next series of runs carefully to see if this looks probable.


Finally, as I have "trained" all of you... one ALWAYS needs to look at uncertainty--which means considering ensembles of many different forecasts.  For example, the UW high-resolution ensemble shows a lot of uncertainty for snow at SeaTac, but most forecast members have something (the mean--black line--is around 1 inch)


Keep in mind that the ground is warm and air temperatures are NOT forecast to go below freezing....that will be protective of the streets unless the snow comes down too fast for melting.  The latest Seattle SNOWWATCH map shows road temperatures in the upper 40s to 50F (see below).   

This is going to be interesting.


Should I Let AI Write My Blogs?

I spend a lot of time thinking about and writing my blogs.   Could AI apps do the work for me?   Could any of you tell the difference? Well,...