September 29, 2023

The Implications of El Nino for Northwest Autumn and Winter

There has been a lot of speculative talk about the implications of El Nino for our winter, with some claiming a certainty of drought and other afflictions.

So let's try to determine reality from hype.

Let me begin by noting that the latest forecasts are for at least a moderate El Nino this winter: GUARANTEED!

Looking at many El Nino model predictions, all have temperatures at least 1°C above normal in the tropical Pacific.  Some more than 2°C above normal.  (see forecasts below for the sea surface temperature anomaly from normal for the Nino 3.4 area).  Folks...this is about as certain as these things get.

With a certain El Nino in store, let's find the implications of El Ninos on our weather (and the rest of the U.S.), by averaging (or compositing) the NOAA Climate Division Data for major El Ninos of the past 40 years.  

An important insight is that the connection between El Nino and our weather depends on the season.

For autumn the effects are more subdued.   Here are the differences from normal of autumn (Oct-ber-December) temperatures during El Nino years.   Modestly warmer than normal (by 0.5 to 1°F) over western Oregon and Washington, and about half that over eastern Washington. Colder than normal over much of the rest of the country


In contrast, there is very little impact on precipitation in the Northwest.  Perhaps slightly drier than normal over the western slopes of the Cascades.  So there is NO reason to expect any kind of drought over the Northwest during the fall rain season.... our big water collection period.  California and the southeast typically get a bit more than normal during El Nino falls.


To make doubly sure you aren't too worried about autumn drought from El Nino, here is the average Palmer Drought Severity Index (PDSI) for El Nino autumns.   NO signal over the Northwest.


What about after January 1? 
 The El Nino signal generally strengthens then.

Here is the temperature difference (anomaly) from normal for January to March.   A very clear warm signal over the Northwest, which generally decreases snowfall.


The January-March precipitation signal is weak east of the Cascade crest and is pretty localized to the western slopes of the Cascades, which gets less precipitation (down around 3 inches)--which is relatively small compared to the 60-100 inches often observed on the slopes.


So what is the bottom line for expected snow impacts of El Nino for the entire winter? 

Below is a NOAA analysis of the difference from average snowfall for the 10 strongest El Nino winter and all El Ninos.    The Northwest tends to get less snow by as much as 10 inches over the mountains.  Considering that much of our high terrain gets hundreds of inches a year, the El Nino impact is modest.


So the bottom line is that the El Nino influence should be modest, with most of the impacts after January.    And keep in mind that not all El Nino years follow the above patterns.   El Nino is only one factor influencing atmospheric evolution over the planet.


September 27, 2023

A Very Scary Cloud over Puget Sound

A line of clouds moved through western Washington yesterday that was intimidating and scary. 

Take a look at an amazing image taken around 12:15 PM yesterday by Murphy McCullough. A bizarre convoluted line of clouds stretched to the horizon.

A lone cruise ship was heading into the terror.....would it survive?


Murphy was a brave soul and he took an extraordinary video, which is shown below.


Particularly terrifying were the torn-up, fractured clouds hanging out of the general cloud feature.  Surely the work of some Lucifer-like creature.

This video is real--not the creation of AI or some Hollywood disaster flic.   Just to prove this to you, here is a view from the Seattle PanoCam, located on the Seattle Space Needle at 12:10 PM


You can see the cruise ship heading into the murk. Reminds me of the movie "Final Countdown" in an aircraft carrier moves into such a feature and comes out at a different time.

Ten minutes later, the line is approaching Seattle and the ship is gone behind a curtain of rain....or is it something more ominous?


So What Was It?

        A strong convective line, made up of thunderstorms and heavy showers, was moving through and the ominous feature you see is called a shelf cloud.

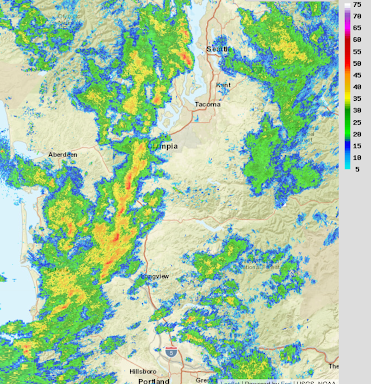
Let's begin by showing you the radar image right before the images above (12:07 PM).  Red is very heavy rain or hail.  Orange and yellow are just heavy rain.  You see the corrugation of the feature....another indication of a powerful line.


The shower line was made up of a series of strong cumulus convective elements, including thunderstorms. 

 Leading the strong storms was a cool outflow of powerful winds....called a gust front.  The gust front pushed air up ahead of it, producing a shelf cloud (see schematic below)


The flow at the leading edge of the gust front--with strong, cold sinking air behind and warm, moist upward-moving air in front of it-- can be turbulent. leading to tendrils of upward motion that produce unusually fractured clouds.   That is what they are called fractus clouds!

And when the line went through, the weather got very interesting.  A profound drop in temperatures, an increase in winds, and, of course, heavy precipitation.  Check out what happened as the line passed across the UW (see below).

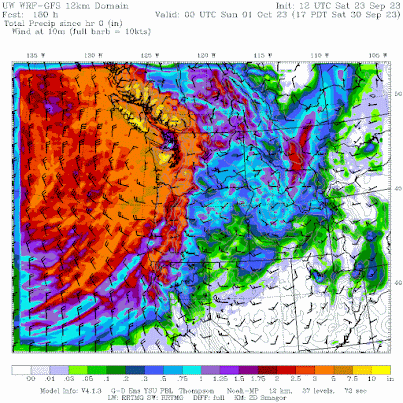
And the weather fun is not over.  An intense mini-low moved across the Oregon/Washington border, bringing strong winds to the northern Oregon coast (see forecast map for 2 AM today).


 Enjoy the weather.


September 25, 2023

Superstorm and Superwaves Offshore

To get big waves, you need strong winds, you need the wind to be around for an extended period, and you want a long fetch over water to allow the waves to develop.

Yesterday and today we have all three due to a nearly stationary superstorm offshore.

First, we have an impressive storm offshore.  Check out the water vapor satellite imagery last night (below), which shows atmospheric water vapor content from space.

Wow... an impressive storm any time of the year, but particularly unusual for mid to late September and unusually far south for late summer.  You can see the plume of water vapor heading into our region from the southwest.  That means rain.


This is an intense low center, with a central pressure last night of around 963 hPa (see sea level pressure map below, with the solid lines being isobars...lines of constant pressure).  That is very low pressure for our neighborhood.  The large pressure differences produce very strong winds.


This is an intense, very slow-moving storm and thus winds have an extended time to work on the water.

That means big waves.

The NOAA WaveWatch3 model predicted big waves offshore last night (9 PM shown), with some offshore waves reaching 25 feet.


During the day today, some of the big waves will reach the Washington and BC coasts, some reaching over 20 ft (see prediction for 4 PM today).    Exciting wave-watching at Westport coming up!

And yes, this is going to be a wet, reservoir-filling week.  The latest National Weather Service National Blend of Models total through Friday afternoon is quite soggy west of the Cascade crest...and even easterly WA gets a piece of it.


September 23, 2023

Heavy Rainfall is Now Certain for the Northwest. But Why Are Some Folks So Worried About Drought?

The latest water-vapor channel satellite image is quite ominous, with a series of very wet weather systems approaching our region.

The weakest of the bunch is starting to come onshore right now (on Saturday), but early next week will be seriously wet.

Let me show you.

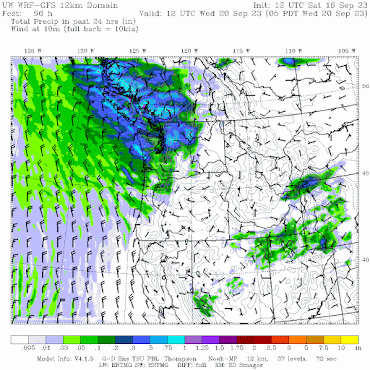
The 72h total precipitation through 5 AM Tuesday, will make any duck happy (below_.  3-5 inches in the Olympics and even more over the mountains of southwest BC.  Substantial precipitation in the Cascades and large amounts over SW Oregon and NW California.


But if you really want to be shocked by nature's wet bounty, check out the one-week totals ending at 5 PM next Saturday.   Wow.   Western Washington, BC, and Oregon are hit hard, with some parts of the Olympics getting nearly 10 inches of rain.   

The wildfire season will be over for the year folks...you can count on that.


All state-of-science weather forecasters use ensembles of many forecasts to gain an idea of the uncertainty of the forecasts.  So below is the ensemble prediction of accumulating precipitation from the NOAA/NWS GEFS ensemble for Seattle.  Each gray line is one forecast, the blue line is the high-resolution prediction, the black line is the average of all the forecasts, and time increases to the right.

All forecasts are going for heavy precipitation, with an average of around 3 inches in Seattle for the next week.
Rivers will rise rapidly, reservoirs will begin to refill, and you can forget about watering your lawn, outside plants, or anything else.  September rainfall in 2023 will come in around double the normal amount (which is about 1.6 inches).  In fact, this rainfall will ensure that our July-August-September totals are near normal (3.1 inches).

Disturbingly, considering this forecast of heavy rain, some unfathomable warnings and actions are taking place in the public sphere.

For instance, a few days ago the City of Seattle asked people to use less water, take shorter showers, stop watering their gardens, and other actions, all based on a dry summer and supposed forecasts of continued dry conditions.    I wonder where Seattle gets its forecast guidance....the prediction models have been emphatic about a turn to wet conditions for the last week.  And this is the time of the year when rain returns.

Of course, the Seattle Times suggested that were are in a serious "drought", with a front page banner article in Friday's paper (see below).

The Times describes an early melt of winter snowpack, hyped reservoirs that are less than 30% of capacity,  talking about a "dwindling" water supply, and OF COURSE, blamed  '"climate change, caused by burning fossil fuels, is making these types of hot and dry summers more frequent and making droughts more severe."


Most of the ST claims are either false or highly exaggerated/deceptive.  Let me prove this to you.

Let's start with the snowpack plot from the Seattle Public Utilities website (below).   The 2023 snowpack above Seattle's Cedar/Tolt reservoir is shown in red, 2020's amount in green and blue shows the normal situation.   Our snowpack this year peaked above normal and later than normal, with the melt DELAYED from normal years.  The Seattle Times needs a fact-checker!


What about the reservoir storage, which the ST notes is only at 30% of capacity?
Deceptively, the Seattle Times did not provide the truly relevant number, the current percentage of normal.

Let's look at the reservoir level plot from the City of Seattle (below), showing this year, 2022, and the average.  

You will note that reservoir levels are typically lower this time of year....perfectly normal and expected after the typical dry summer around here.  After a warm, dry summer we are a bit below normal.

By how much?  The average is about 30 million gallons of active storage and this year we are about 26 million gallons. So right now Seattle reservoirs are around 87%  (26/30) of normal.  Doesn't sound as scary does it.  Both the Seattle Times and Seattle Public Utilities should have said this.  But they didn't.


And what about the bogeyperson of global warming as the cause of our dry summer?

Completely unsupported.  We were dry because of the persistent large-scale weather pattern that made California WET, and such patterns have no connection to global warming.

But I can prove this to you in another way.  If global warming was a contributor to drier summers around here you would expect to see a long-term trend toward drier summers, since the earth is already warming from our emissions of greenhouse gases, such as CO2.    

Here is a plot of summer rainfall (June-August) for the period of record (1904-2023), with a trend line put on for reference.  Yes, the last summer or so has been a bit dry, but the trendline is UP (wetter).  And many years were drier than this year.   Really little indication of global warming, which should be most evident from roughly 1980 and later.


I know some of you are upset when I note errors and exaggeration in the Seattle Times and other media (and yes some politicians).  But a democracy can not function properly if citizens are misinformed and the Seattle Times and others are doing so in a very deliberate, unfortunate way.
______________________________________________

A reminder that I am teaching Atmospheric Sciences 101 this quarter.

You can attend in person or online.

I should note that Washington State residents over 60 can take it for a very small charge (like $25)  through the ACCESS program.

And I would certainly welcome any UW undergraduate or graduate students.
The class website is here if you want more information.


September 21, 2023

Valley Drainage Season

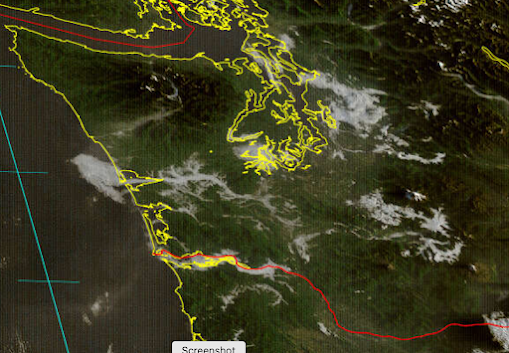
The high-resolution visible satellite this morning around 7 AM was striking.   Few clouds overhead at higher elevations, but lots of sinuous clouds in river and mountain valleys.

As I will explain, this is a very typical situation this time of the year.


During the late summer and early fall, nights are getting much longer, but the extensive cloudiness of winter has not yet begun.   Thus, the ground is able to radiate infrared radiation to space and to effectively cool.   The cold ground cools the air near the surface.  Cool air is denser and thus is heavier than warm air and tends to sink down the slopes of valleys (see figure below).

Cool air pools at lower elevations of the valley, and then slides down the valley towards lower elevations.


If the air has sufficient moisture, the cooling along the valley slopes can cool the air sufficiently so that the moisture condenses into small water droplets--thus producing shallow valley fog.

This is why many of Washington's river valleys filled with fog and low clouds this morning. 

Let's take a look in more detail!

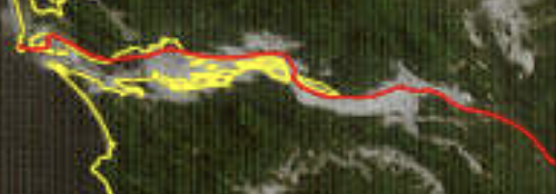
First, consider the Chehalis River Valley (below).   The valley was filled with fog and amazingly a "fog jet" pushed into Willapa Bay and then appeared to contribute to a cloud bank along the shore.


Near Seattle, the Green and White River Valleys had fog.


And the great Columbia River had a wide valley fog area.


But fog is not the only thing that can drain into valleys.    So can smoke!

There are some smoldering, dying fires at higher elevations in the Olympics, and their smoke has descended into some river valleys draining to lower elevations.  This morning's visible satellite image showed some of that valley smoke action! (see below).


Finally, you might ask whether modern weather prediction models can predict such valley fog.

It is a very, very difficult forecast:  you need very high resolution and the ability to handle the complex physics near the surface.

Most weather prediction models do not have the resolution to deal with such valley fog, but the UW uber-high resolution WRF forecast system (with a grid spacing of 1.3 km) has a chance.

Below is the prediction of low-level cloud at 5 AM this morning from the UW WRF model.   We got a good piece of the low-level clouds in the Chehalis Valle--and even the coastal clouds!-- but underplayed the clouds in the Columbia River Valley.


_____________________________________

Announcement:  Portland American Meteorological Society Meeting on Saturday, September 30.

When: Saturday, September 30th 2023 @ 10AM
Where: OMSI (Oregon Museum of Science and Industry) in Portland. Main auditorium. 1945 S.E. Water Ave. in Portland.
Driving directions to OMSI: http://tinyurl.com/6rrz8em
Meeting: This meeting is free and open to all ages of the general public. 
Overnight Accommodations: For overnight accommodations in Portland, please see: http://tinyurl.com/7boqrsf 
Subject: The Portland office of the National Weather Service and Dr. Cliff Mass (U of W) will reconstruct and dissect the record-setting February 2023 Portland snowstorm in this technical meeting. Maui wildfires will also be discussed.

September 18, 2023

Heavy Rain Coming to the Northwest: The End of the Wildfire Season and Beginning of the Snow Season

The region has palpably entered a fall-like period of cooling temperatures and the return of precipitation.

But to quote the old saw:   "You Ain't Seen Nothing Yet"

A moderate frontal system will move in tomorrow (Tuesday) night, bringing rain across the region (see total through 5 PM Thursday below).   Maybe a half-inch in the Cascades.  

Enough to knock back local fires to a smolder.


But the real action is still ahead.  A weak front will move in Saturday morning (see 24 hr precipitation ending 5 PM Saturday).


But that is not the main story.  Early next week a potent atmospheric river of substantial moisture will be headed into our region (see total water in a vertical column for 5 PM Monday).  Mama Mia! That is a decent atmospheric river.  Blue indicates lots of water vapor heading our way.


The result will be bountiful local rainfall, as the moist air is forced to rise by our regional terrain.

The 24-hour precipitation total ending 5 AM Tuesday includes several inches in our mountains.

And the 72h precipitation total ending Wednesday morning has as much as ten inches at high elevations. Wow.

Folks this will end the local wildfire season, which has been below normal this year.  And with lots of moisture coming in and moderating temperatures, the higher elevations will start to pick up the first snow of the season (see forecast snow total map through September 28).


September 16, 2023

The Last 80 Degree Day This Year For Puget Sound Country?

Yesterday's high at SeaTac was 84F and today much of the central and south Sound reached the upper 70s to low 80sF.  

But with a significant shift towards a more autumn-like pattern this week and a rapidly weakening sun, there is a good chance that SeaTac Airport and much of Puget Sound country will not see another eighty-degree day until next spring.

Take a look at the visible satellite image this afternoon (below).  The Pacific Ocean does not have a summertime look!  A weak, but broad, frontal system is offshore and some of its clouds are moving in tonight.  A more potent cyclone and front is now over the Gulf of Alaska, and we will get a taste of its southern portions in a few days.


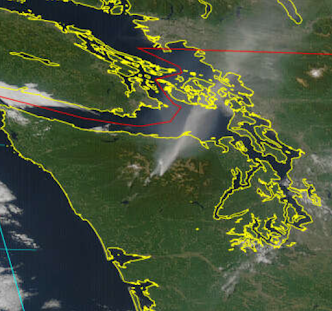
The most notable feature in this morning's satellite image was a plume of smoke from a few small, lightning-caused fires near Hurricane Ridge in the Olympic Peninsula.  Considering its location and its natural origin, the Park Service is letting it run its course.


Turning to the forecast, here are the predicted temperatures through 26 September in Seattle.  Highs in the 60s and lower 70s.

As shown by the climatology data for SEATAC, with the red shading showing all-time daily records, once one gets into October, hitting 80F is increasingly unlikely, after mid-October it never has happened!


What about rain?   

We are likely to get some.  

The first band will be relatively weak, with the total through 5 PM Monday only bringing light showers to western WA, but more meaningful precipitation over southwest BC.   Cooler temperatures and high humidity will knock back the Olympic Mountain fires.


The second, more potent system will come in on Tuesday/Wednesday morning, with real rain over NW Washington and southwest BC.


Finally, I am getting a number of complaints from blog readers in southern CA about the wet summer.  Did you know this was the wettest summer on record in Los Angeles... going all the way back to the 1940s?  Wow.


As a result of bountiful California rain and cooler-than-normal temperatures, wildfires are well below normal this year in CA (and were also below normal last year).  

Want the proof?  Here are the last statistics from CALFIRE, the official fire agency in California.  The media likes to paint an "end of world" picture about wildfires, but the truth is different.


September 14, 2023

A Stunningly Good Hurricane Forecast

 Numerical weather prediction has improved dramatically over the past decades, providing potent warnings for extreme weather, such as hurricanes.

There are few better examples than the prediction of Hurricane Lee, which will make landfall near the Maine/New Brunswick border late Saturday.

The U.S. global model, the GFS, has been spectacularly skillful in predicting this storm, well more than a week ahead.

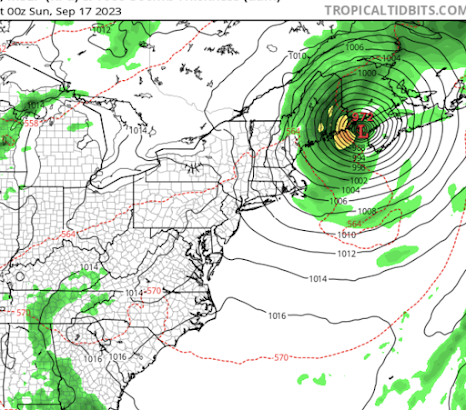
The latest forecast run shows the storm making landfall near the international border around 5 PM PDT on Sunday.  That is a 54-h hour prediction  This is so close enough in time...and so consistent with other model forecasts... that you can be assured that this is close to what will happen.


But how did extended forecasts do?

The 72-h prediction is pretty much the same.


The 126 h prediction is nearly identical in position:


The 198 hr (8.25 day) forecast has a strong hurricane in pretty much the same location.


Folks, this is a stunningly good forecast for over a week ahead.

Professor Brian Tang of the University of Albany has a wonderful website that verifies the hurricane track (position) forecasts of major modeling/forecasting systems.  The results for Hurricane Lee are shown below for forecasts of 120 hours (5 days) or less.  

In general,  the track accuracy gets better for shorter forecasts...which makes sense. But let's compare the American model (blue color, AVNO), the European Center model (red color), and the UKMET office model (green color).  The human (official) forecast is shown in black.

Wow.  The American model is STUNNINGLY accurate at all projections in time.  

It is FAR better than the nominally top two global modeling systems in the world:  the European Center and UKMET.  The forecast error is under 100 km (60 miles) for all projections shown. 

Extraordinary.  


The model forecasts are better than the official Hurricane Center forecasts....I suspect that humans are probably hedging their bets with the European Center model solution.😅

This was a truly excellent forecast and not the only success for the American model this season.  Hopefully, this extraordinary performance will be persistent for future storms, perhaps reflecting recent improvements in the U.S. global modeling system.

Finally, I should note there are real policy implications of the rapidly advancing weather prediction skill now available to decision-makers.  Excellent forecasts can help protect people and economic assets from extreme weather.

Better forecasts are the first line of defense against severe weather. 

 Better forecasts have great potential for reducing the negative impacts of global warming.  

One of the reasons I have spent some time trying to calm down some who are panicking over global warming and extreme weather.

Climate-related deaths are down...and I mean WAY down.  Better adaptation and a richer world have contributed, but so have better forecasts.

Importantly, we have only begun taking advantage of improved forecast skill.  

The winds on Maui were nearly perfectly predicted on August 7-8 of this year, yet 115 people died and nearly 10 billion dollars in damage was done. We could have easily stopped the carnage, by shutting off the power and effectively evacuating the population.

Most major wildfires are related to strong winds and such winds are often forecast with great skill.  Few should be a surprise.

In summary, coastal New England has had nearly a week to prepare for strong winds and heavy precipitation (over northern Maine)-- and we can be proud of the technological advances and investments in NOAA  and in other government agencies that made such forecasting prowess possible.

El Nino is Rapidly Collapsing

 It's finally happening.    The pesky El Nino, with warmer than normal surface waters across the central and eastern tropic Pacific, is ...