To what degree is anthropogenic global warming contributing to Washington State wildfires?
If 90% of the blame for Northwest wildfires is due to anthropogenic (human-caused) global warming and 10% is due to fire suppression, poor forest management, or people starting more fires, then the logical response is to put most of our efforts into reducing atmospheric CO2. A climate-dominated problem.
If 90% of the blame is due to past fire suppression, forest mismanagement, invasive species, and human encroachment, then we should put most of our efforts into fixing the forests and other non-climate measures. A surface-management problem.
And yes, the percentages could be somewhere in between.
Supporters of the carbon fee initiative (1631) are suggesting that the recent wildfires are mainly the result of anthropogenic climate change and using the fires to push their carbon fee plan.
And Governor Inslee has stated explicitly that the fires have been made much worse by climate change.
In contrast, others, including a number of folks in the forestry community, have suggested that poor forest practices are the main cause of most of the wildfires over the eastern side of the state.
It is important to note that relative role of global warming in influencing the threat of wildfires may change in time. For example, global warming could be relatively unimportant today for wildfires, but of great importance later in the century when temperatures will be much warmer.
The Need for Better Information
There is actually very little limited quantitative information on the role of global warming on Washington State wildfires. Which is kind of strange considering the importance of the issue and the authoritative statements being made by some. A lot of hand waving, but not much data.
So let's examine the issue in some depth, using a more quantitative approach than most. But before I do so, let me give you the bottom line.
Human-caused global warming has played only a minor role regarding Washington State wildfires through today, but will become much more important later in this century.
Now let me provide some evidence for this conclusion.
How Has Global Warming Changed Washington's Summer Climate?
Before we look at the correlation of global warming and wildfires, we need to know how much Washington State climate has changed during the past half century or so, and then estimate how much of that change is due to anthropogenically forced increases in greenhouse gases. To gain some insight into this, I secured the official NOAA/NWS climate division data averaged over Washington State for summer (June through August).
First, consider daily mean temperatures from 1930 to today.. Very little warming until the mid-70s and then perhaps 2°F overall during the past 40 years.
Summer average maximum temperatures have similar pattern of change--again roughly 2F warmer since the mid 1970s.
There is a substantial research that suggested that the radiative effects of increasing CO2 in the atmosphere became significant for climate forcing something around the 1970s. And there was an important shift in a mode of natural variability, the Pacific Decadal Oscillation (PD0) during the mid-70s: a shift from the cool to warm phase of this oscillation, which would have resulted in warming over the Pacific Northwest.
Now the question is how much of the recent warming shown above is due to anthropogenic global warming and how much is due to natural variability.
A group of researchers at the UW (including myself) are working on this question, using the most sophisticated approach applied to date: an ensemble of high-resolution regional climate runs forced by the best global models. This is the gold standard for such work. We started with global climate models driven by the most aggressive increase of greenhouse gases (RCP 8.5) and then ran a high-resolution weather prediction model (WRF) driven by several climate models over time (1970-2100).
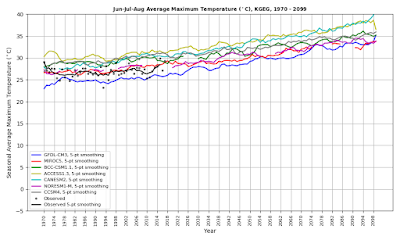
I don't have this output interpolated to the exact boundaries of WA state (working on this now), but let me show you the projections for summer max temperatures from the high-resolution model for two sides of the state (Hoquiam, HQM, and Spokane, GEG) forced by several climate models (see below in colors). I also show the observed temperatures during the contemporary period at these location). Virtually all of our simulation show greater warming at Spokane then along the coast, so let me show you that first.
Between 1970 and roughly 2000 there is very little change in observed or modeled temperatures at Spokane, and roughly1.7F warming between 2000 and now in most of the simulations. Since natural variability will differ between the simulations, the 1.7F average of all of the runs is a reasonable estimate of the impact of global warming until now. And note how the warming revs up later in the century if the aggressive increase in greenhouse gases continue s(about 7F warming!).
At Hoquiam, near the WA coast, the warming is less for both the recent decades and into the future. Perhaps 1F of warming through this year.
Now, I could show you a lot more material, but my conclusions from looking at a lot of high-resolution model data is that anthropogenic global warming due to increasing greenhouse gases may well have warmed up the state as a whole by roughly 1-1.5F during the past half-century, with any additional warming coming from natural variability (e.g., the PDO). I really doubt that there would be much disagreement about this estimate from members of the atmospheric community.
What about changes in precipitation?
Summer (June to August) precipitation has always been relatively modest (4-5 inches) in our state (our summers are very dry), and there appears to be a modest wetting trend through 1980 and some drying since the late 1990s (see below). In contrast, annual precipitation has been very constant (also below)
 |
| Summer Precipitation for WA State (1930-2017) |
 |
| WA State Annual Precipitation |
What do the climate simulations suggest about precipitation trends?
The annual precipitation will slowly increase according to the models (not shown), but what about summer? Spokane summer precipitation has always been low (around 2.5 inches typical for June through August) and will remain low. Any decline is small--a half-inch at most. The recent dry years look like natural variability.
Let's compare that to Seattle on the western side of the State. Summers are equally dry as Spokane, but there is a more clearcut drying-- by roughly 2 inches by 2100, and perhaps .5 inches during the past years. These results are consistent with previous studies by the UW climate impacts group and others indicating a slow increase of total annual precipitation, but a small downward trend in summer precipitation over our area.
So to summarize. Looking at past climate data and the best model information, one concludes that increasing greenhouse gases may well have warmed out state by 1-1.5F during summer (June through August) over the past half century, had little impact on annual precipitation, and perhaps dried an already very dry summer by perhaps .5 inches.
But how did global warming impact the recent wildfires in Washington State? And how will future warming impact them?
We are now ready to answer this question.
But first we needed a list of the annual area burned and number of fires in Washington State over time. It turns out this is a difficult information to get--which is surprising considering its importance. I was able to get an Excel file from Josh Clark of WA State DNR with the fire information from 1992 to the present. The prior period has not been digitized, with fire information in cabinets somewhere. Oregon and California has done a better job in creating a long-term digital record of their fires.
OK, we will use what we have. Here is the number of acres burned by wildfires over WA state since 1992. A very slow trend upward, except for the HUGE peak in 2015, the year with the big ridge and crazy-warm spring.
The number of fires (see below) have been nearly constant in the long term, with some ups and downs/
But now the really interesting part. Let's plot the acres burned against warm season (June through September) temperatures (see below).
This is really fascinating. A very slow increase of fire acres with temperature, with considerable scatter, showing that acres burned is not that temperature sensitive. The one big year was the warmest.. 2015 with 61.4 F and nearly 1.2 million acres burned.
The bottom line of all this is that warming temperatures can explain only a small portion of the variability in Washington wildfires.
What about precipitation? Here is the plot of WA state precipitation for May through Sept since 1992. A very slight downward trend, with the big fire year (2015) not showing anything anomalous.
Another "scatterplot", this time of acres burned versus precipitation, is presented below. Very poor relationship, with the suggestion of a decline in burned acreage with greater rainfall. And the precipitation only explains about 2% of the variability of acres burned! This is not surprising because our region is naturally dry during the summer and being a little drier doesn't make that much of a difference. Like being a little more dead.
The Essential Message Here
Climate/weather changes do affect wildfires over Washington State. Warmer temperatures and lesser precipitation correlate with increasing acreage, but the relationship is not a strong one. The correlation of summer precipitation with wildfire acreage is very, very weak and summer temperature only explains less than a quarter of the variability in wildfire area.
Then we look at the look at the amount of climate change produced by human-caused greenhouse warming so far, and we find it is relatively small. Perhaps 1.5F for WA State temperatures and a slight drying over the summer.
You put the lack of sensitivity together to temperature/precipitation with the small climate changes due to global warming and one has to conclude that human-caused climate change is undoubtedly NOT a major driver of the increased wildfires and wildfire smoke we have seen during some recent years.
Based on my extensive reading on the wildfire issue, discussions with forestry experts at the UW, and a number of seminars/meetings I have attended, my conclusion is that the real culprits for our invigorated fire/smoke situation include:
1. Nearly a century of fire suppression and poor forest management that have produced unnatural, explosive forests, particularly on the dry side of our state.
2. Huge influx of people into the urban-wildland interface and forest areas that help initiate fires and make us more vulnerable to them.
3. Invasion of highly flammable, non-native species like cheatgrass.
And we should not forget that fire is a natural part of our east-side forests.
Claiming the climate change is the big villain in the current wildfire situation, may be a useful tool for some ambitious politicians and for those searching for arguments to support climate-related initiatives, but the truth is probably elsewhere. In the FUTURE, as temperatures warm profoundly (particularly during the second half of the century), the influence of human-produced global warming on our wildfires will clearly increase substantially.
Only by a sober, fact-driven approach, such as thinning, debris-removal, and proscribed burning of our east-side forests, with will be able to improve the health of our forests and reduce the potential for megafires and big smoke production. Even if we could stop anthropogenic climate change in its tracks this year, we still need to deal with the issues of forest management, human initiation of fires, and human changes at the surface.
PS: Although we had considerable background smoke from Canada, the really extreme smoke periods (August 21-22 in Puget Sound) was associated with fires over NE Washington, not Canada. Same thing in 2017, with WA fires resulting in ash falling on Seattle.
PSS: Some folks might bring up the Pine Beetle issue. I have read several papers and talked to experts in UW Forestry that suggest that rather than lack of cold temperatures, unnaturally dense east-side forests and lack of fire allowed the Beetle kill. In any case, peer-reviewed papers suggest that pine beetle infestation does NOT contribute to fires.
____________________________________
A local forest landowner named Michael August has written a very interesting perspective on NW forests and smoke, found here.


