October 31, 2021

Pluvius Jupiter Reigns over the Northwest

 The ancient Romans believed that rainfall was controlled by the great god Jupiter....or to be more exact, one of the aspects of the deity, Jupiter Pluvius.

Even in modern times, some folks would suggest that drought was associated with sleeping god:


And did you know that a town in the very wet southwest corner of Washington State is known as Pluvius?   I need to visit that place.


Jupiter Pluvius appears to have taken up resident over our region....and is not leaving very soon.

Over the last two months, much of the Northwest and northern California has had above normal precipitation (see map below, greens, blues, purple), with large portions of central/northern California receiving more than 400% of normal precipitation.

Jupiter's bounty has ended the fire season in much of the western U.S., restored soil moisture, and began the processes of refilling the region's reservoirs.

And Jupiter was thoughtful of the other gods, allowing near-perfect conditions for Halloween.

But Jupiter's intent is clear: this is going to be a wet autumn...and that is of particularly importance with a La Nina winter ahead, which generally brings excessive rainfall over the Northwest.  

The NOAA Climate Prediction Center is going for wetter than normal conditions for the next 8-14 days:


The three-month seasonal precipitation forecast through the end of January?  

You guessed it, wetter than normal.  Trust me, you don't want to see the extended forecast after that.  (Hint:  slugs will be very happy)


The latest extended forecast through the end of November by the European Center is much wetter than normal for Washington through northern California, with an infernal plume of water (blue of course), coming off the Pacific.


Here in western Washington, we will be dry through roughly 2 PM tomorrow, followed by a wet front, with the UW forecast model showing large amounts of rain through next Saturday morning:


So my advice:  get your rain gear ready.  

I just purchased some nice rain pants from REI to make my bicycle commuting to the UW less soggy.  And yes, make sure you have a good weather radar app for your smartphone, which allows you to spot the relatively drier intervals during the moist months ahead.  


October 29, 2021

Why are there atmospheric rivers? And a very pleasant weekend ahead. All in my lates podcast!

Atmospheric rivers bring plumes of moisture to the West Coast and often heavy precipitation.

But why do atmospheric rivers exist?  What conditions create them?   

All is revealed in my latest podcast (see below).

A satellite view of the moisture associated with Thursday's potent atmospheric river


And the podcast also provides the forecast for the next week, including the critical day of Halloween when little goblins are making their rounds.

You can listen to the podcast below or through your favorite podcast server.


Some major podcast servers:

 HTML tutorial HTML tutorial
Like the podcast? Support on Patreon Become a Patron!


________________________________

An Important Message for Seattle Voters

_____________________________________________

The Second Edition of My Northwest Weather Book is Now Available!

My new book is greatly improved and expanded over the first edition, with new chapters on the meteorology of Northwest wildfires and the weather of British Columbia.  A completely revamped chapter on the effects of global warming on our region.  And it has been brought up to date with recent weather events and the imagery is improved greatly.
 

Where can you get it?

Local bookstores, such as the University of Washington bookstore.  The UW Bookstore has just received several dozen copies.

Or secure a copy from the publisher:  UW Press.

Or Third Place Books in Lake Forest Park or Seattle.

And yes, there are online sellers like Amazon and Barnes and Noble.

October 28, 2021

A River Runs Through Us

Today was a very wet day over Washington State and southern British Columbia.

And you can blame a river...an atmospheric river of moisture streaming out of the subtropics for most of the wet action.

A model forecast of the amount of water vapor in a vertical column of air, valid at 8AM this morning, shows a "juicy" plume heading right into the Northwest.


A satellite view shows the plume of moisture (highlighted by the white oval), as well as its origins in the tropical Pacific.  The air of the very warm western tropical Pacific is particularly laden with water vapor.

And the visible satellite image this afternoon shows a plume of clouds associated with the moisture river.   A front is found at the southern edge of the cloud mass....the brighter white clouds indicated by the red arrow.


When the atmospheric river hits our mountains, it is forced to rise, releasing massive amounts of precipitation.  The UW model total precipitation forecast for the 24h ending 5 AM tomorrow morning (below) is impressive, with as much as 5 inches at higher elevations and even a few inches at some lowland locations.

You are probably wondering, how much did we get today so far?  Here are the numbers (for the 24 h ending at 7 PM)

We have already received 4-5 inches on the windward  (southwest) side of the Olympics and the western slopes of the North Cascades.


With saturated soils from the previous rains, several of the rivers are surging with all this precipitation, particularly those draining the north Cascades.   

Take a look at the latest river stage information from the NOAA/NWS River Forecast Center in Portland (see below).   Several rivers are at minor to major flood stage (orange and red colors).  Several others are near bankfull.


The Skagit River, for example, will approach major flood stage tomorrow....so be careful up there.


The good news is that a ridge of high pressure will build over the weekend, resulting in dry conditions, plenty of sun, and a wonderful opportunity to either rake leaves or view fall colors near their height.
________________________________

The Second Edition of My Northwest Weather Book is Now Available!

My new book is greatly improved and expanded over the first edition, with new chapters on the meteorology of Northwest wildfires and the weather of British Columbia.  A completely revamped chapter on the effects of global warming on our region.  And it has been brought up to date with recent weather events and the imagery is improved greatly.
 

Where can you get it?

Local bookstores, such as the University of Washington bookstore.  The UW Bookstore has just received several dozen copies.
Or secure a copy from the publisher:  UW Press.
Or Third Place Books in Lake Forest Park or Seattle.
And yes, there are online sellers like Amazon and Barnes and Noble.

October 26, 2021

Is California Experiencing More "Weather Whiplash"?

During the dry years, the people forgot about the rich years, and when the wet years returned, they lost all memory of the dry years. It was always that way.

---John Steinbeck, East of Eden

___________________________________________________________

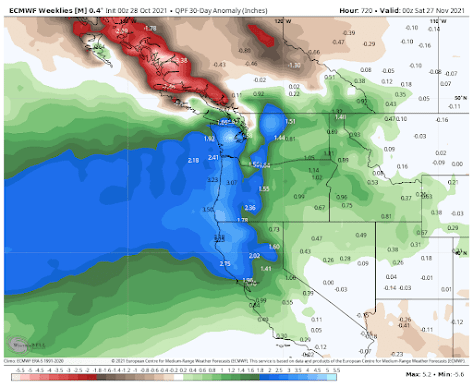
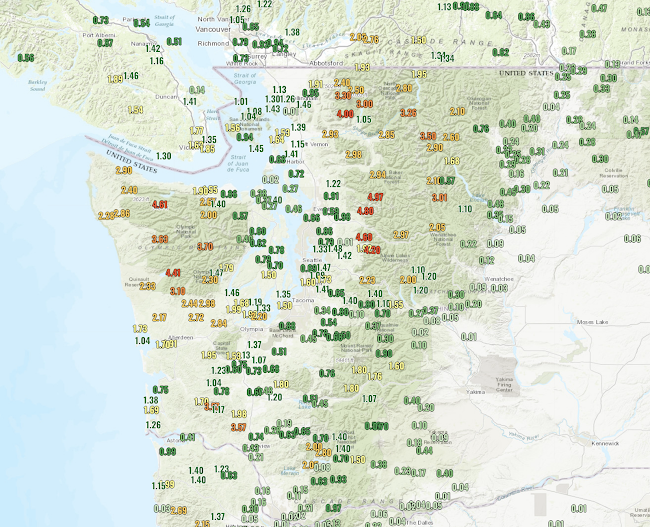
After the heavy rains of the past few days over central and northern California, a number of media outlets are talking about California suffering from "Weather Whiplash", since the record precipitation this autumn follows a year of drier than normal conditions.

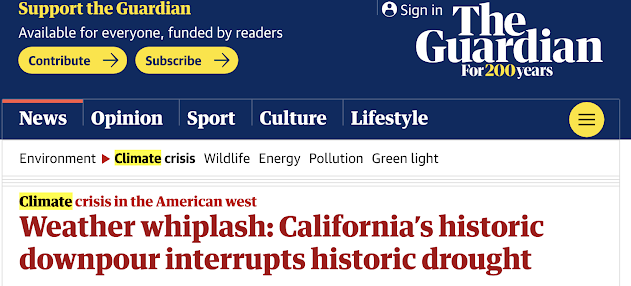
And several media outlets are going much further, claiming the the "whiplash" is the result of climate change and is worsening over time (see below).  Such articles quote from scientists whose research suggested increasing whiplash based on their examination of climate model projections.


Well, what is the truth?

Global warming has been significant for several decades so we should see evidence of increasing "whiplash" if climate change is a major forcing mechanism.  Strangely, none of the handful of studies in the scientific literature on whiplash has looked at the observational record.  Just the climate models.

But in this blog, the analysis will be done!

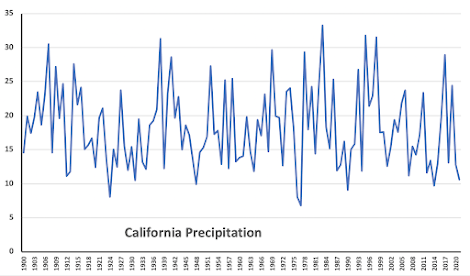
Let's examine the NOAA/NWS climate division data for California, and specifically, the precipitation for California's wet season of November through March from 1900 through 2021 (see below).

One is struck by several things.   

There is really not much trend in California's winter precipitation.

And there is a lot of up and down variability---yes, weather whiplash.   But there does not seem to be any long-term trend for more or less precipitation whiplash.


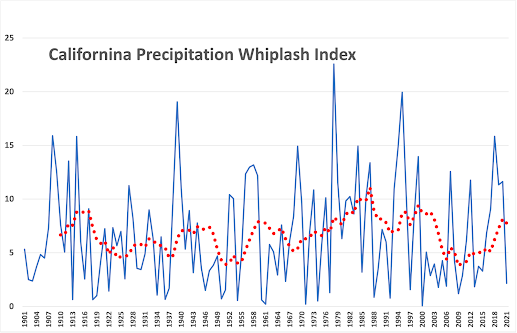
To illustrate this point, let's plot the yearly whiplash...a WHIPLASH INDEX.. by simply taking the difference between each year's and the previous year's winter precipitation for California. Since we don't care which way the whiplash goes (wet to dry or dry to wet), I will plot the absolute value of the difference.  I also plotted (red dots), a 10-year moving average to smooth out the variation over time (see below).

Really very little long-term trend in California precipitation whiplash, with the worst of it from roughly 1975 to 1997.


So the bottom line in all this is that there is really little OBSERVED evidence for a long-term increase in year-to-year whiplash for California precipitation and certainly no evidence that global warming is making whiplash worse during the past few decades.

Why has California experienced precipitation whiplash so often?

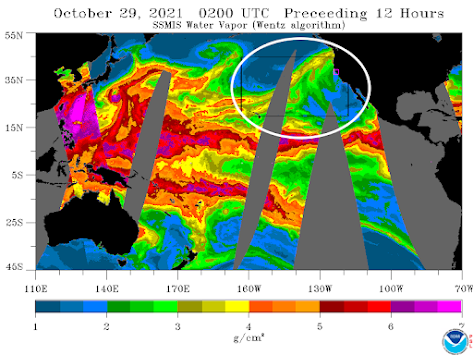
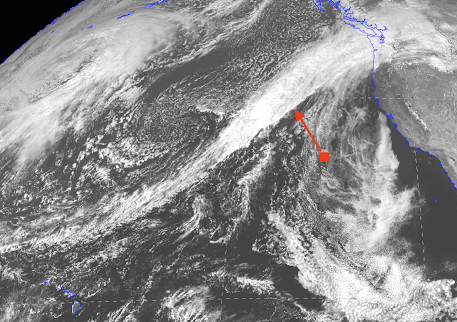
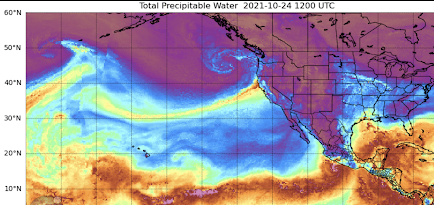
Because it is near the boundary between the dry subtropics and the moist, storm-laden midlatitudes.   A few times a year, the jet stream dips southward, bringing in potent storm systems, or scooping moisture from the tropics in atmospheric rivers.   Miss a few of these excursions and California has a dry winter.  Have an active year when the jet stream pushes unusually southward....heavy rain and precipitation.

In contrast, the more northern Pacific Northwest is reliably under the influence of the storm-laden jet stream.  Less whiplash.  

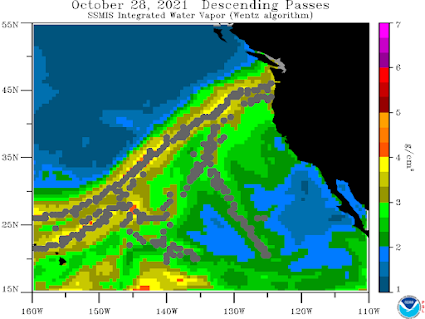
An atmospheric river heads into California

Will whiplash get worse in the future?

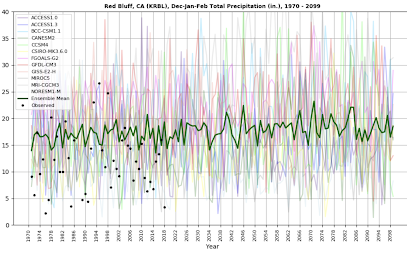
I am involved in regional climate simulations, using an ensemble of high-resolution projections driven by an ensemble of many global climate models.  This is the gold standard for such work.  We ran these simulations using the highly aggressive RCP 8.5 scenario for increasing greenhouse gases, which is certainly not realistic since it assumes that mankind keeps on burning increasing amounts of coal, among other things.

Below are the results for Red Bluff in northern California (winter precipitation) through 2100, with the green lines being the average of the many forecasts.   During the end of the century, there is perhaps some suggestion of occasionally larger whiplash, but also extended periods of less whiplash.  But again, the amount of CO2 emissions is undoubtedly too large.

I think the jury is still out on whether California whiplash will increase significantly during the second half of this century.    And the research studies that have suggested big increases during this century also predicted major whiplash increases during the past two decades.  These have not verified with observations.

 But the jury, viewing the observations, have released a definitive ruling on whether precipitation whiplash is increasing during the past 120 years in California:  no evidence for it, case dismissed.


October 24, 2021

A Record Storm and the Power Outages Begin

This morning, the offshore storm rapidly intensified and achieved record status, with the central pressure dropping to at least 943 hPa (the previous record for our region was 950 hPa).

And there is a very good chance it is even deeper right now.  

Here is the latest visible satellite image of the storm (around 10 AM).  

Stunningly beautiful creature, with the frontal clouds swirling towards the low center.  And you can see very unstable air with lots of convection (e.g., thunderstorms) over the southwest portions (the popcorn-looking clouds).  Some of that activity will reach us later today.


The official National Weather Service analysis indicated 943 hPa at 8AM (see sea level pressure map below)


The low center is now passing nearly directly over NOAA buoy 46005 (see map), about 300 nautical miles off the coast.


Below is the plot of sea level pressure at the buoy as of 11 AM.  Wow.  The pressure is down to 942.5 hPa and still dropping rapidly.  The winds are nearly calm there, as expected near the center of the low. 


As I mentioned, the central pressure of this storm is a record for our neck of the woods.  

To show this, here is a wonderful figure created by Dr. Ryan Maue, the shows the lowest pressure observed over the northeastern Pacific over the past 70 years using the ERA reanalysis dataset.  The star shows where our 943 hPa low is right now.    Notice there are green colors in the region of the star--indicating lowest pressures of 954 hPa and higher...not even close!  

To get similar record storms to our visitor today, one must go northwestward into the Gulf of Alaska and the Aleutian area.

We are all experiencing history..

This morning the region is experiencing stage 1 of this event, with a very strong east-west pressure difference driven by the approaching storm (see sea level pressure forecast for 11 AM below).  Mama Mia, there are a LOT of isobars.


Driven by this pressure gradient, powerful easterly winds have occurred over the eastern slopes of the Cascades and some pushed into south Seattle.  As a result, there are lots of power outages with tens of thousands of people out of power.


Strong easterly winds are blowing in the eastern Strait of Juan de Fuca  and off the coast now (up to around 60 mph)

In the next stage of the event, the low will move closer, bringing powerful winds to the coastal area (yes, some will lose power).  The plot below shows the forecast for 5 PM today.   And yes, there should be some big waves reaching the coast by then as well.
And tomorrow morning, as the weakened low goes north of us, the north-south pressure difference will increase, bringing stronger (southerly) winds to Puget Sound...and particularly northwest WA waters.

Before this is over, I suspect a few hundred thousand folks will lose power, with the situation worsened by the unusual direction of some of the strong winds (easterly in the interior) and the fact this is the first major blow of the season for many.
_____________________________

My Podcast Has More Background Information on the Big Storms of the Northwest:

____________________________________________

The Second Edition of My Northwest Weather Book is Now Available!

My new book is greatly improved and expanded over the first edition, with new chapters on the meteorology of Northwest wildfires and the weather of British Columbia.  A completely revamped chapter on the effects of global warming on our region.  And it has been brought up to date with recent weather events and the imagery is improved greatly.
 

Where can you get it?

Local bookstores, such as the University of Washington bookstore.  The UW Bookstore has just received several dozen copies.
Or secure a copy from the publisher:  UW Press.
Or Third Place Books in Lake Forest Park or Seattle.
And yes, there are online sellers like Amazon and Barnes and Noble.

October 23, 2021

The Storm's Future is Now Known

The models have converged to a consistent solution, the storm is beginning to "bomb", and I can now provide a forecast with some confidence.

This will be the strongest Northwest storm on record, but its strength will collapse as it approaches the coast of Vancouver Island.  More quickly than any storm in my experience.

And there will be strong winds over land, but not from the south, but from the east, as air is pulled westward by the immense, powerful storm offshore.

Let me begin by showing you the latest water vapor satellite image over the eastern Pacific (below), with the dark areas indicating dry conditions.

This is a very potent storm, with massive clouds and extreme darkening, which indicates strong sinking behind the low center (you can see the moisture curling up).  Such sinking is a sign of vigor.

Both the American (GFS) and European Center (ECMWF) models indicate very rapid intensification over the next 24h, with the storm catching down to around 943 hPa (see below for 8 AM Sunday).  This is a "bomb" cyclone, with the pressure dropping more than 24 hPa in 24 hours.


There has never been a storm this strong in the nearshore waters of our region.  

The closest was 950 hPA in 1981.

Both U.S. and European modeling systems predict massive swell/waves approaching the West Coast from this monster storm, reaching 30 feet on Sunday evening!


Both modeling systems indicated that the storm will very rapidly weaken on Monday, making landfall on Vancouver Island with a central pressure around 985 hPa (see US model forecast below) at 11 PM Monday.


I don't think I have seen so rapid a collapse of a storm over water.

But what will happen overland?   Will there be some strong winds?
The answer is yes.

Let me show you.  The three stages to this unusual event.

Stage 1:  An intense low offshore and a large east-west pressure difference over the region

At 8 AM Sunday a huge, deep low center will be due west of the Columbia River outfall.  The lines on the map are isobars, lines of constant sea level pressure.  A very large pressure difference is over us, with lowered pressure to the west.   In the presence of terrain, such a pressure gradient will produce very large easterly (from the east) winds in terrain gaps, and strong winds offshore.


Below are the predicted wind gusts at 11 AM on Sunday (in knots).  Strong easterly gusts (to roughly 55 knots) in the eastern Strait of Juan de Fuca as the air in the Strait accelerates to the west, and winds will accelerate down the western slopes of the Cascades, with powerful gusts from Enumclaw to North Bend.  Strong southeasterly winds offshore.


Stage 2. A Still Powerful Storm Moves Towards Land

Here is the sea-level pressure forecast at 8 PM Sunday.  Just wow. An absolutely intense pressure difference over the coastal waters of Oregon and Washington.  Very strong winds.


The predicted wind gusts at this time will be substantial along the coast, some reaching 60 knots (roughly 70 mph).  Strong winds over the volcanic peaks and over portions of NW Washington.


Stage 3:  The Weakened Low Moves North of western Washington

With the (weakened) low center northwest of western WA, there will be a substantial north-south pressure difference over Puget Sound and the Strait of Georgia (1 AM Tuesday is shown).  That means WIND.

Winds will be strong, southerly, and gusty over the inland waters of Puget Sound, with gusts accelerating to 30-40 mph, especially near the water.


And don't forget the precipitation.   California getting hit hard, with up to 8-10 inches through Tuesday morning (see forecast below).  And there is going to be significant snow in the North Cascades and British Columbia this week.


Time to stop.....enough weather for a day!

My Podcast Has More Background Information on the Big Storms of the Northwest:

____________________________________________

The Second Edition of My Northwest Weather Book is Now Available!

My new book is greatly improved and expanded over the first edition, with new chapters on the meteorology of Northwest wildfires and the weather of British Columbia.  A completely revamped chapter on the effects of global warming on our region.  And it has been brought up to date with recent weather events and the imagery is improved greatly.
 

Where can you get it?

Local bookstores, such as the University of Washington bookstore.  The UW Bookstore has just received several dozen copies.

Or secure a copy from the publisher:  UW Press.

Or Third Place Books in Lake Forest Park or Seattle.

And yes, there are online sellers like Amazon and Barnes and Noble.


October 22, 2021

Update on the Strongest Coastal Cyclone in Northwest History and an Introduction to Pacific Cyclones. All in my New Podcast

 My new podcast is out (see below) and in it I describe the hurricane-force storms that can hit Northwest and provide an update on the extraordinary Sunday/Monday event.

And I have to admit something:  meteorologists are not exactly sure where the big storm will make landfall.

However, the formation of an unprecedented storm is nearly a sure thing, with the very latest forecasts of sea level pressure for Sunday morning from both the U.S. and European models predicteing the strongest Northwest storm in history with pressures below 945 hPa (see below).  Just crazy.  Equivalent to a category three hurricane.

European Model forecast of sea level pressure for 5 AM Sunday

The American model forecast at the same time.

The strong winds and vast size of the storm will send large swell and wind-driven waves onto our coast, with some getting to 30 ft or more. Be careful if you go wave watching.

Wave forecast for Sunday night

In the podcast, I talk about the disagreement between the models on where this monster storm will go, and how it will weaken over time.  I will blog about this issue on Saturday....so keep tuned.

You can listen to the podcast below or through your favorite podcast server.


Some major podcast servers:

 HTML tutorial HTML tutorial

Like the podcast? Support on Patreon Become a Patron!


________________________________

An Important Message for Seattle Voters

_____________________________________________

The Second Edition of My Northwest Weather Book is Now Available!

My new book is greatly improved and expanded over the first edition, with new chapters on the meteorology of Northwest wildfires and the weather of British Columbia.  A completely revamped chapter on the effects of global warming on our region.  And it has been brought up to date with recent weather events and the imagery is improved greatly.
 

Where can you get it?

Local bookstores, such as the University of Washington bookstore.  The UW Bookstore has just received several dozen copies.

Or secure a copy from the publisher:  UW Press.

Or Third Place Books in Lake Forest Park or Seattle.

And yes, there are online sellers like Amazon and Barnes and Noble.

Should I Let AI Write My Blogs?

I spend a lot of time thinking about and writing my blogs.   Could AI apps do the work for me?   Could any of you tell the difference? Well,...