May 30, 2016

Washington State is Losing Its Signature Views. Can We Restore Them?

Meteorologists really care about views:  there is nothing we love better than a expansive vista of clouds and mountains.   And Washington State is the home of some of the most stunning viewpoints in the nation, often located on local peaks or near major water bodies.  

But inaction by State government, either deliberate or not, is resulting in the loss of some of the best viewpoints in the State, mainly because of the growth or encroachment of trees.   A bit of judicious pruning could fix the situation in a few hours, something advocated in this blog.   Let me give you a few examples.

Historically one of the grandest view of our region, and perhaps the best in the State, has been found at the top of Mount Constitution on Orcas Island (see map).


A stone tower built on the summit by the WPA during the 1930s used to provide a stunning 360° view, with the lofty height of the Olympics, Vancouver Island, Mount Baker and the Cascades, the islands of the San Juans, and Puget Sound surrounding the lucky visitors.   One of the great views of the world.


Unfortunately, the trees around the summit have been left to grow and the views to the south, west, and north have been lost or severely degraded.  To appreciate the loss, here is an information sign on the top of the summit structure, showing the vast and impressive scene to be enjoyed (at least several decades before).  The problem:  you can't see any of it today because the trees have grown up.


Or perhaps you have enjoyed the hike to the top of West Tiger 3 near Issaquah, one of the most popular hikes in the State and only 30 minutes from Seattle (see map).  The view from the top used to be amazing, with the entire Sound laid out below you.


But, again, trees have been allowed to grow, wiping out nearly the entire view (see below)


Or what about Chuckanut Drive, south of Bellingham?   It WAS the most beautiful coastal drive in the State with amazing views of the San Juan Islands (see map).


 You guessed it.   Trees have been allowed to grow, blocking the stunning views.


Now I could give you many more examples, but you get the point.  One of the reasons that folks love living in Washington State and why tourists like to visit are our amazing views of the water and mountains.  But we are losing many of our most precious viewpoints because the State seems to have a policy of letting trees grow, even if such growth is robbing us of some of the most uplifting and inspirational views.

Is there a policy not to protect views?  To always let trees grow?   Is ANYONE in State government responsible for ensuring that views are maintained?   I love trees as much as anyone, but views are important and it would be a shame if future generations are robbed of the views that many of us have valued and savored over the years.  Let's do something about it.  And if you know some other good examples, please leave a comment or email me.


May 28, 2016

June Gloom in May

June gloom came early this year, with a transition in mid-May to the typical June low clouds, sprinkles, and occasional sunbreaks.    Actually, this kind of weather in late May is not that unusual.   Here is a plot of Seattle-Tacoma temperatures for the past four weeks (with normal highs and lows shown as well).   Above normal temps through May 15th, and then a switch was flipped, with most days not even reaching the normal highs.
East of the Cascades, shielded from the low-level marine air by the Cascades, the transition was not as profound, as shown by temps at Pasco in the Tri-Cities.  Conditions have been very close to normal during the past two weeks, which is good for agriculture and those worried about wildfires.
Visible satellite imagery tells the story another way.   Take a look at the visible image from 12:30 PM on Thursday.  Classic late spring pattern, with a huge field of low clouds over the eastern Pacific.  Look closely and you will see the low clouds pushing to the Cascade crest, with coastal California from San Francisco southward socked in.


Why the low clouds?  Blame high pressure!  Yes, you have read that correctly.   Here is the surface pressure and wind forecast for 2 PM on Thursday.  A big area of high pressure over the eastern Pacific centered due west of the CA/OR border.


Why does high pressure offshore produce gloomy conditions west of the Cascade crest?

Many reasons!   First, simple pressure differences.  With high pressure offshore and lower pressure inland, low level cool air gets pushed into western Washington and Oregon.  

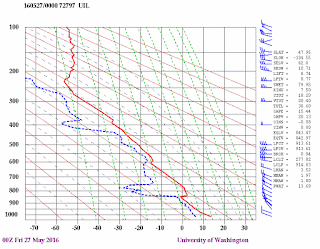
Next, high pressure is associated with sinking air aloft, something meteorologists call subsidence.  Now the sinking has to decrease near the surface.   Sinking air causes warming, so there is more warming aloft.  With more warming aloft, a stable layer or an inversion (temperature increasing with height) can occur.    In fact, if we look at the vertical sounding at Quillayuate (on the WA coast) on Thursday at 5 PM, that is exactly what happened at around 800 hPa--roughly 4000 ft (red line is temperature, blue dotted line is dew point).  Below the inversion the air is nearly saturated (temp and dew points are nearly on top of each other).  A stable layer aloft allows a layer near the ocean surface to moisten and get full of low clouds.

But as in those late-night commercials,  I have to say: WAIT, there's more!  The high pressure results in northerly flow along the West Coast, moving cooler water from the north southward and resulting in upwelling of cooler water from below to the surface near coast (particularly from southern Oregon down to central CA)--see sea surface temperature plot from yesterday below.   Cool water helps cool the air to saturation, enhancing clouds!

So high pressure  offshore gives us sustained, cool, cloudy weather.   Generally not that much rain--often just some light drizzle and sprinkles.   But hopefully enough to discourage Californians from moving up here (although our increasing traffic is our new secret weapon in that regard).

Now some of you might think that May or June gloom is going to decrease under global warming.

 Think again.   Some of our latest regional climate simulations suggest that global warming could make it worse!  (see graphic below of change in March-May low clouds, between 1990s and 2090s)  Blue is increasing low clouds.  Why?  Because the interior of the continent heats up faster than the ocean and warming temperatures causes lowering pressures.  So the onshore pressure gradient increases under global warming, result in enhanced marine air influx west of the Cascade crest.

 Another good reason why you should support the carbon tax initiation, I732, and do what you can to reduce your carbon footprint.


May 25, 2016

Steven's Pass Melt Out

On Saturday, Steven's Pass had its "melt out", which is defined as the first day of the summer when less than two inches of snow water equivalent (SWE) was left on the ground.


It was the 8th earliest melt out in the last 36 years.  The average melt-out date the last 35 year is June 2, so it is about 1.5 weeks early.   Folks care about the melt out date because it is an integrated measure of the depth of the snow pack and the degree of spring warmth, and both of those are expected to be influenced by global warming.  Increased levels of CO2 should result in warming that will result in less build up of mountain snowpack in the winter and a quicker melting in the spring of what snow does accumulate.

Last year (2015) was a profound example of warming causing a reduction in snowpack and a very early melt off date (the earliest on record!).    Some folks are saying that there is trend towards poorer snowpacks and earlier melt-outs, and that that this is an indication that we are already experienced human-caused global warming.   But is it true?

Mark Albright, past Washington State climatologist, has plotted up the Steven's Pass melt-dates from 1981-2015 (see below).  The annual melt-out dates are shown by the blue dots, the mean over the period by the horizontal gray line, and the 5-year running mean by the purple line.   There is no evidence of a long-term trend for earlier melt-out dates.  In fact, just the opposite....melt out dates are trending later (which implies cooling or greater snowpacks or both).  Last year (2015) was an outlier, although two other years came close.

So there doesn't appear to be any global warming signal producing earlier snow melt offs in our region.
To drive this point home further, here are the mean melt-out dates for recent decades (again, thanks to Mark Albright).  It appears that the melt-out dates are getting progressively later, just the OPPOSITE of what we would expect global warming would do.

1980s: 30 May
1990s: 1 June
2000s: 2 June
2010s: 4 June (thru 2016)

This small delay in the melt out is consistent with other independent measures of snow content in the Cascades, such as the April 1 snowpack amount, also show little trend.
One or two bad years are not an indicator of a long-term trend and the evidence, as shown above, suggests minimal decadal trends of snow in the Cascades.

May 23, 2016

Most Weather-Related Wildland Firefigher Deaths Can Be Prevented: Here's How.

Last summer three wildland firefighers died near Twisp, Washington as wind reversed during the afternoon.

In 2013, nineteen firefighters died near Yarnell, Arizona as the gust front emanating from some thunderstorms caused the fire they were working to explode.


Between 1910 and 2014, 1096 wildland firefighters died while they were fulfilling their missions, and a significant number of these tragedies were weather related.

And as I will describe below, most weather-related wildfire deaths can be avoided if fire agencies are willing to apply current generation observing and forecasting technologies, while enhancing critically needed personnel.


As someone who specializes in local weather in the western U.S., regional weather prediction, and the effects of terrain on regional flow patterns, I have always been interested in the weather associated with major wildland fires.   Looking at major recent fires associated with firefighter deaths (such as Yarnell and recent Twisp fires), I have concluded that each was associated with a sudden wind shift and that these wind changes were easily foreseeable by someone possessing meteorological knowledge and state-of-the-art observational resources (click on the links for these two fires to see my blog analysis).

The Yarnell fire deaths were associated with the outflow boundary of cooler air emanating from thunderstorms to the northeast, something evident from weather radar imagery and regional surface observations.  The Twisp disaster was connected with a windshift, associated with cooler air moving across the Casacades, that was predicted by regional weather prediction models and was evident in real time from surface observations.

The convection and gust front associate with the Yarnell Tragedy was evident in weather radar imagery

Recently, I listened to an excellent presentation on "tragedy fires" at the Northwest Weather Workshop that was given by Andy Haner, an experienced National Weather Service meteorologist specializing in wildfire prediction.  In his talk, he went through five fatal fires--Yarnell (2013), Twisp (2015), Thirty Mile (2001), Frog Fire (2015), Beaver Fire (2014)--and found that four of them were associated with clearly predictable weather phenomena.  He had not worked up the Thirty Mile Fire (he is a relatively young man), but I had--it was the same story:  a trained meteorologist could have easily seen the threat coming.  Furthermore, many of the deaths occurred for relatively new and small fires, fires for which no incident meteorologist had been assigned (Incident Meteorologists (IMETs) are forecasters specially trained to work during severe wildfire outbreaks).

Considering the seriousness of this issue, I conferred with some very experienced fire weather researchers in the Forest Service (who preferred anonymity).  They agreed with my and Haner's analysis:  virtually all the major wildland firefighters deaths could have been prevented with better information and guidance using current observations and forecasting technology.

Disturbingly, official reports on these wildland firefighter deaths do not consider or provide superficial coverage of this crucial issue (for example, the initial Twisp report is here).  Very disappointing.


So based on my analysis of several fires and discussions with a number of fire weather experts, let me describe how we could end most wildland firefighter deaths.

(1)  ALL wildland firefighting efforts should have supported by trained meteorologists that are continuously watching the situation.  Importantly, this includes even small or emerging fires (since they are involved in many of the deaths).  This does not require one meteorologists per fire, since a meteorologist can watch over several in an area (think of the meteorologists being similar to flight controllers that supervise several flights at a time).  These meteorologists would be responsible to provide guidance, forecasts, and warnings to fire crews.

(2)  All wildland firefighting crews will have continuous and uninterruptable communications to the meteorologists.   This means that every crew must have satellite phones before they go to a fire.

Weather observation and prediction technology has greatly improved during the past decades, allowing meteorologists to provide radically better support for wildland firefighters.  For example, we have large number of  surface weather observations throughout the U.S., including remote areas.  To illustrate, here is map that shows the latest wind observations over the Washington State (and there are much more available than is shown here).


Weather radar imagery are providing constant coverage over much of the western U.S. (although there are some gaps).  In those areas, high-resolution satellite imagery is available.

New weather prediction technology is now available, such as the High Resolution Rapid Refresh (HRRR) forecasting systems that uses all available observations to create high resolution analyses and short-term forecasts each hour (see below)


And there are many more observing and forecasting resources that I have not mentioned.  Simply put, modern meteorologists have an extraordinary set of tools to determine what the weather is doing now and what it will be doing in the future, even in relatively remote areas.    Importantly, there is no reason that sudden windshifts, the source of many of the wildfire tragedies, can not be diagnosed and forecast.

The deaths of brave young men and women can be greatly reduced if trained meteorologists with the proper tools are assigned to all fires.  With modest resources, such meteorological support could quickly become a reality.   

And there is one more thing, and it is perhaps controversial.   Firefighting teams should never risk their lives to save isolated homes or buildings.   Most of regional forests are meant to burn and have burned for millennia.   Homes and buildings don't belong there and it should be understood by all that the buildings are expendable and will not be protected.  They are not worth risking human lives.

Not worth a human life.

May 21, 2016

A significant precipitation event from the "wrong" direction

As predicted, a deep trough has formed over the West Coast, bringing cooler temperatures and precipitation.   The atmosphere has reconfigured itself during the past week, as the pesky ridge of high pressure, which brought warmth and aridity to our region, has moved to the west.

As shown by the latest (Saturday AM) infrared satellite image (see below, with my annotations), an upper low center is found over eastern Oregon, with substantial moisture rotating around it into our region.    There is a substantial EASTERLY (form the east) component of the winds and that produces upslope precipitation on the normally dry easterly slopes of the Cascades.  Eastern WA is also getting rain.


How much so far?   Here is the 24h totals ending 9 AM Saturday over central Washington.  Impressive amounts (over an inch in some locations) over the eastern slopes, will many locations wetted by more the .5 inches.  Good rain over northeast Washington.


A band of precipitation is now circling into western Washington (see radar).   My garden will be happy.


Normally dry, eastern Oregon has done very well from this event, with some eastern Cascade locations getting over 1.5 inches.


The latest WRF model forecast for the next 24 h (ending 5 AM Sunday), brings lots of rain to the central and southern Cascades, with relatively dry conditions along the coast.


There are a lot of folks worried about heat and drought this summer and potential impacts such as wildfires and poor harvests.     This event is very positive as has been the reconfiguration of the atmospheric circulation.  Eastern WA soil moistures are near normal and our reservoirs, such as those in the critical Yakima drainage are full and above normal (see below for yesterday...and that is before the today's rain).
El Nino is collapsing and the latest  NOAA CFSv2 seasonal forecast predicts wetter than normal conditions from June, July and August (spoiler alert:  the skill of these forecasts is not great).

However, with warm water still offshore, El Nino still be present, and other factors, the subseasonal forecast models are projecting warmer than normal conditions over our region this summer (see below).   Not crazy warm like last year, but .5-1 C warmer. Warm temperatures encourage evaporation and thus contribute to surface drying.

_________
SaveKPLU

If you are a listener of KPLU, please consider contributing to the effort to save the radio station.  They need 7 million dollars to succeed and they have now garnered 6.2 million.  Your pledge will be matched by generous other donors.     The savekplu website is here.

May 19, 2016

Cherry Weather Worries

Eastern Washington State is one of the premier growing regions for sweet cherries in the world, possessing both good soils and climate.  But cherries have weather vulnerabilities that can cause severe loss of fruit.    One of them is frost during the budding season, but that has not been much of a problem during the past few years due to our unusually warm weather.


But there is another: rain just before harvest that can cause fruit to split.  Recently, unusually heavy rain hit California, halving their harvest.  Very bad.


Typically, the Washington State cherry harvest starts around June 1st.   But with unusually warm weather, the date will probably move up to May 23rd, according to what I have been reading in the Ag magazines.  Very soon.  


The problem is that with a trough of low pressure moving over us, significant rain is forecast during the next several days (see the WRF model 24h total ending 5 PM Saturday)... .5-1 inches over some of the cherry growing region over the eastern slopes of the Cascades.  Heavier amounts in some location.  This is very good for general moisture over eastern WA and  to keep the fire threat down.


According to the agricultural experts at WSU,  when cherries are close to harvest the pressure inside increases.  Rain, particularly when the weather is warm, can be absorbed through the outer surface of the cherry (called the cuticle),  sometimes leading to the bursting of the cherry.  Heavy thunderstorms during warm weather are particularly problematic.  Burst cherries may not look great, but are certainly valuable for many uses (juice, jam, etc.).  They are less valuable.


Growers have a number of approaches to deal with rain on cherries, including blowers and running helicopters over orchards.


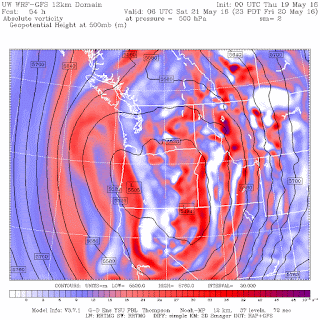
The main rain threat is on Friday/Saturday as the upper low passes south of Washington and precipitation swings northward over eastern Washington, accompanied by easterly (upslope flow)--see upper level (500 hPa) map for Friday at 11 PM.

 Since we are very early in the cherry season, only a limited amount of the crop is vulnerable.   But orchardists and meteorologists will be watching the situation closely.   I certainly will--I love cherries and limited supply can cause the price to rise.

May 17, 2016

Troughzilla

Well, we had Ridgezilla, the intense area of high pressure that brought low snowpack and warm temperatures last year.  Or the persistent and powerful Godzilla El Nino.  But during the next week we will experience something different:  Troughzilla, an area of intense low pressure over the west coast that will make it cooler and wetter than normal at least through next week.


Let me show some upper level  (500 hPa, around 18,000 ft) forecast maps that document the  development of this beast.   Today was a fine day, with a modest ridge over us (see map for 5 PM today-Tuesday).   This is the last day of warmth for a while.

 By 5 PM Wednesday, a trough of low heights (or pressures) has developed over the eastern Gulf of Alaska.
 One day later (Thursday 5 PM), a very strong low center is centered over western Washington and a huge, powerful ridge over the central NE Pacific.

Friday afternoon?  Now it has grown and extended into California.


 On Saturday at 5 PM, the infernal beast is now over the entire West Coast.

As you can imagine, this pattern is not going to result in any heat waves, as illustrated by the latest forecast for Seattle from the Weather Channel. No more 70s or 80s for a while.   Temperatures at or even below normal.

Precipitation?   You bet.   For the next 72 hours, wet offshore and modest rain over our local terrain.


 The next 72 h (ending 5 AM Monday) is far wetter, with several inches over the mountains, lots of moisture over eastern Washington, and substantial rains over northern CA.

The atmosphere has shifted to a very different configuration, one we have not seen for a while.  Find a sweater and protect you tomatoes.

Power Outage Prediction Maps for the Friday/Saturday Storm

 As a new service of this blog, I will indicate the areas where powerlines might be damaged by the approaching storm.  You can't say you...