March 30, 2020

Cold Air Blast and a Few Snowflakes in Western Washington

This is not an April fools prank.

A shot of cold air will push into western Washington late Tuesday and Wednesday, with strong northeasterly winds from the Fraser River Valley extending into northwest Washington, and even a chance some of you will spot some snowflakes.  In April.

The predicted surface weather map for 8 AM April 1st is, well, chilling.  Very cold air (purple/blue colors) is pushing into southern British Columbia, with a low center near the Columbia River bars.  If this was January, I would getting my snow shovel handy.


With cold, dense air and high pressure in southern BC and low pressure over southwest Washington, a large pressure difference (gradient) will develop over the Fraser River Valley,  accelerating cold air into Bellingham and NW Washington.  This is shown by wind gust forecast for 8 AM Wednesday, with winds reaching 35 knots.  The northeasterly flow will then run into the Olympic Peninsula...and as we shall see, bringing low-level snow.


Later in the day, the strong, cold northerly winds will hit Puget Sound.  I will guarantee you one thing...it won't feel like April 1st. 


But what about snow you ask?  The accumulated snowfall (not accumulation) through 5 PM Wednesday show lots in the mountains (up to 1-2 feet) and if you look closely you will note a few inches getting close to sea level on the NE side of the Olympics.   Even some sea level or near sea level locations may see a few flakes.


The upside to all this is that our snowpack is getting enhanced, setting us up for plenty of water during the summer and a good omen for the upcoming wildfire season.  If this was a normal year, I would be talking about good skiing--but it isn't.  There is a chance there will be enough snow for some mountain recreation if the quarantines are lifting by the end of the month.  We will see.

So let me give you the online snow experience and view the top of the Crystal Mountain run around 6 PM tonight.


March 28, 2020

An Encouraging Weather Forecast

We all need some good news and I will give that to you. 

The weather is going to improve by next weekend here in the Northwest.  Much warmer and even some sun.

But there is also some bad news....we will have to get through a cool/cloudy period first.

Let's face it.  It has been cool and murky this week, a situation that heightened the stress of all the virus news.  Below are the temperatures at SeaTac during the past two weeks, with the normal highs and lows plotted.  Our daily maximum temperatures have been well below normal the last six days.   Like 5-10F below normal.  Plus lots of clouds and light rain.

Tomorrow will be similar and then a much stronger system, with real rain, will hit Monday, associated an unusually energetic upper level trough (see upper level map for 5 PM Monday).   If this was January, we would be worried about lowland snow with such a pattern.


Fortunately, as the week progresses an upper level ridge of high pressure will build along the West Coast and temperatures will rise.   To warm you up, here is the latest forecast for high and low temperatures at SeaTac based on the European Center ensemble forecasting system (running their model many times and taking the average).  High temperatures climb roughly 10 degrees between this weekend/Monday/Tuesday and later in the week.  You will notice that.


The National Weather Service GEFS ensemble of many forecasts shows a cooling trend for a few days, following by warming (see below).  Each forecast is plotted with a line and the black line is the average of all of them.   Warming towards 60F by April 4/5.  


 Southern California will warm into the upper 60s to low 70s....perhaps high enough to slow down the coronavirus there.  Also clearing skies and progression into spring will produce higher ultraviolet

radiation values along the southern tier of the U.S.:  not good news for the virus, which can be degraded or killed by UV.  Below are the forecast UV index for Sunday and Wednesday.  Big improvement over the western U.S.


This is a good time to plant your spring/cool season veggies if you have a garden.  That is my plan this afternoon!


March 26, 2020

Will the Coronavirus Outbreak Affect Weather Forecasting?

Weather prediction is an essential technology that both protects the economy and saves lives.

National Weather Service personnel are considered critical personnel and are still working, but they are dependent on numerical weather prediction models, which in turn are dependent on the quality and quantity of weather data going into them.

And it appears that one important data source is declining rapidly in volume, aircraft observations.

And such observations are particularly important for the West Coast of the U.S., which has a vast ocean to our west.

To produce a numerical weather prediction, a three-dimensional description of the atmosphere needs to be created, something called the initialization. Over land there are lots of surface observations and balloon-launched weather observations (radiosondes), but obviously there are far fewer of these  over the ocean.  In the old days of numerical weather prediction, forecast skill was less downstream of oceans because of the large oceanic data voids.

But this situation changed profoundly with the advent of weather satellites and the use of weather observations from commercial aircraft.  The oceans now had substantial numbers of observations, driving a rapid increase of weather prediction skill. Weather satellites are now the dominant source of oceanic weather information, but aircraft observations (known as ACARS observations or AMDAR) are quite important.

The distribution of aircraft observations in January 2020 is shown below (courtesy of the the European Center --ECMWF).  The number of observations is shown by the colors (red and orange are the most).   Importantly, the are a large number of observations between the West Coast and Hawaii, most of which are at important jet stream elevations (30,000 to 40,000 ft).  There are also considerable number of observations from flight going between North America and Asia.


As noted by this graphic from ECMWF, the number of aircraft observations has grown rapidly due to more flights and increased numbers of aircraft with the appropriate weather sensors.


A number of studies have examined the importance of aircraft observations for weather prediction.  As illustrated below, automated aircraft observations (AIREP) are about fourth in importance overall (more important than surface observations!), and data denial experiments at ECMWF, in which they reran forecasts without using the aircraft observations) indicated a decline of forecast skill in the upper troposphere (again roughly 30,000 to 40,000 ft) by about 10% and some degradation near the surface (by roughly 3%). 

Not the end of the world, but significant.  But what about regions downstream of oceans?  Could the impact be larger?   That is an analysis I have not seen.


But there is a problem, particularly for us on the West Coast for short-term forecasts and for the entire nation in the longer term.  There is a huge decline of air travel going on now.   And the decline in air travel is about to plummet.

Hawaiian Airlines will soon cancel most of its flights to the mainland, and Alaska is planning on pausing on about 70% of its flights (some to Hawaii).   Flights to Asia are down profoundly already.  The latest statistics from the FlightAware website indicates nearly 16,000 flight cancellation today, with nearly half cancelled out of San Francisco and about a quarter at SeaTac and LA (red colors below).   This is only the beginning.


So how much degradation in forecasts will occur as aircraft observations profoundly decline? To what degree will the impacts be greater for land areas downstream of oceans?

Considering the key role of satellite observations, one might expect the degradation to be modest, but perceptible.

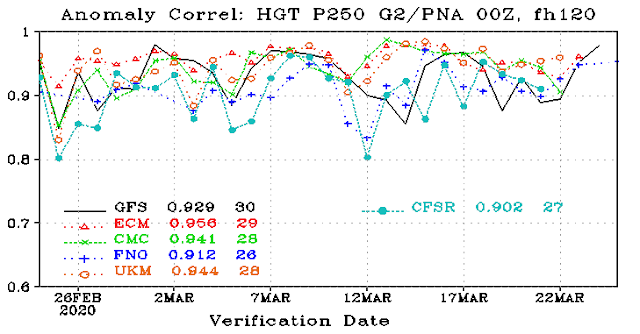
The latest forecast skill statistics over the Pacific/North American area (called the PNA region) available from the National Weather Service for the five-day forecast of near jet stream level (see below) does not suggest anything significant at this point (particularly since there is a lot of natural variation in forecast skill).  In this plot, 1 (top) is a perfect forecast and several forecast models are shown (black--US GFS, red-European Center, green-Canadian), orange-UKMET).


Numerical experiments to determine the impact could be done, but will probably be relatively low priority.


Aircraft in flight at 9:30 AM this morning (from the wonderful FightAware site).  This is already well down from normal, but a lot more than will be flying in a week


In the longer term, the impacts on weather prediction will be substantial for other reasons.  Weather research and communication is being profoundly degraded.  Major meetings and conferences have been canceled (including the NW Weather Workshop) and research is made difficult and far less effective.  We are all trying to work at home and use online communication, but the degradation is real and will increase with time.

March 24, 2020

Weather Discussion Online!

Since many are stuck at home, I thought it would be fun and useful to provide a forecast discussion with lots of images and graphics.  Check it out and let me know if you want me to do it regularly.


My next version will be at higher resolution. 

And I am thinking of doing one where I can interactively answer weather questions....just need to figure out how to do that.....

March 23, 2020

Amazing Rainier Mountain Wave Video On BING

There is an extraordinary video on the front page of BING right now (https://www.bing.com/)


Gorgeous, multi-level lenticular clouds.

Watch it carefully.     There is a multi-level stack of several lenticular (mountain wave) clouds, reflecting the complex structure of moisture approaching the mountain.

You can see how turbulent the lower portion of the lenticular cloud stack is.

Thanks to Professor Arthur Nowell for bringing this video to my attention.

March 22, 2020

Is the Air Quality Better This Week Because of the Closures?

I have gotten a number of emails from folks wondering whether the local air quality has improved as many of us stay home from work and other activities.

As I will show in a minute, there is no obvious evidence of better air quality this week, and, in fact, during the past days the air quality has declined to moderate in some areas.

This morning, the U.S. EPA AirNow website showed a region of moderate air quality (yellow colors) over western B.C., Washington, and Oregon.


During the day, with a warming sun and better mixing, things improved substantially

Taking a look of a plot of air quality during the past week at Seattle (blue), Tacoma (red), Spokane (tan), and Marysville (purple), there are good levels (below 50) for Monday through Friday, but moving into the moderate zone last night.  The substantial daily (diurnal) variations are obvious.


Air quality got better each day as solar heating causes the atmosphere to become well mixed.

Perhaps we can get some insights by plotting the air quality for the past years in Seattle (see below).
Mama Mia!   The air quality today was the worst in a year!  I don't see how this could be due to coronavirus.


The moderate air quality this week was associated with relatively dry conditions over the region and high pressure aloft (see upper level map last night) which resulted in sinking in the middle atmosphere.  Such sinking produces warming aloft and a lack of clouds, which

in turn allows good cooling at the surface (infrared radiation is able to escape the atmosphere more easily without clouds).  With warming aloft and cooling at the surface, we tend to develop an inversion (temperature increasing with height), which helps trap pollutants near the surface.   Take a look at the plot of temperature and dew point last night at Salem, Oregon, last night.  The inversion is very clear.


It appears that meteorology (light winds, inversion, clear skies) is overwhelming the loss of emissions from less industrial and transportation activity.  Yes, less folks are driving (I-5 was a ghost town yesterday evening), but all of us still have to heat our homes and apartments.  In fact, folks are staying home more, so home heating is probably way up.  Bus routes are still going and people still have to drive to get food and supplies.  Might air quality have been a bit worse without the restriction?  Perhaps.  But the effect is not obvious.

And this week we will experience something that was rare during the past several days:  some rain.

March 20, 2020

Temperature Forecasts, Cherry Blossoms and Covid-19

To start on a positive note, the Cherry Blossoms are in full bloom on the UW Campus, with the visual effect enhanced by the beautiful, sunny weather.  (I should note that the UW is not encouraging folks to visit the blosssoms in person).


There is a lot of interest in the temperature/coronavirus relationship and what the weather forecasts suggest.

During the past several weeks there have been several papers submitted (but not yet reviewed) suggesting that coronavirus flourishes for daily mean temperatures roughly from 32F to 55F.  Warmer than that, the virus has problems.

The temperature map for the past month suggests that the only area of the U.S. that has been at sufficiently warm (14C--57F or more) to slow up the virus was the southeast U.S. (see below).

Unfortunately, the latest forecasts do not offer warm-temperature virus relief for much of the country during the next week.  Let me show that by presenting the 11 AM PDT temperatures for the next few days.  Look for the blue, yellow, orange and red colors for virus-poor conditions.

Saturday morning: SE U.S. is good.  Not so good for the NW and NE.

Monday--same thing,  but improved  (warm) condition in most of Texas.
 By Wednesday, warmer temperatures are over the SE, the central plains, and up into the Carolinas.
 Fast forwarding to next Sunday (March 29th), little improvement for the NW and NE.
The bottom line is that mother nature is not giving most of us the warm temperatures needed to suppress the virus    But April is not far away.

And if you want some good news, the coronavirus testing at the University of Washington (Med School's Virology department) is now finding a stabilization in the number of positive evaluations (see graphic below).   Another good piece of news is that the overwhelming number of tests are negative (folks are getting sick from the flu and other illnesses).


UW Virology have been extreme heroes during this event, providing COVID-19 testing when CDC was failing, as well as revving up to do thousands of tests per day.  Makes one proud to be a husky.  Check out their web site---and consider providing a donation for their excellent work.

March 18, 2020

Kona Low Hits Hawaii with Heavy Rain and Tornado Warnings

During another time you might feel very sorry for the poor folks vacationing on Kauai.   Instead of enjoying their Ma Tais under sunny skies and modest trade winds, they are suffering from heavy rains, very strong southerly winds, severe thunderstorm, and unusual tornado warnings

The cause of this bounty of inclement weather?   A very large Kona Storm.

A Kona storm (or Kona Low) is a low pressure center that develops to the west or southwest of the Hawaiian islands that bring moist, cloudy, or unstable air into the Hawaiian islands.  Associated with low-level winds from the south to west, Kona lows can bring rain to the western and southwestern ("kona") sides of the islands that are normally rainshadowed by the terrain.  Typically trade winds are from the east to northeast, thus the eastern/northeastern sides are typically the wettest.

Here is a satellite image of the situation on Tuesday.  You can see the swirl of clouds around the Kona Low and a large band of rain (and thundershowers) circling into it.  The band crosses over Kauai (point of arrow),


A sea level pressure analysis earlier in the day showed the low at the surface (see below)


An  upper-level map (500 hPa--about 18,000 ft) illustrated the well-defined circulation aloft and strong southwesterly winds approaching the island,


Kona Lows are associated with cool air aloft and unstable conditions that are released by the upward motion associated with the disturbances.  On Tuesday morning thunderstorms and heavy rain were approaching Kauai and the National Weather Service not only put up a severe thunderstorm warning, but even provided a tornado watch  for portions of Kauai and the nearby island of Niihau (see radar below).  In fact, the Doppler radar showed circulation.


 Precipitation totals were amazing.   The 72h totals ending about noon PDT shows about 8 inches on Kauai and around 5 inches on the southern side of the Big Island.


Examining Kauai in more detail, there are lots of values near 10 inches and an amazing 16.83 inches near the crest of famous Mt Waialeale, one of the wettest places in the world.


The heavy rain has closed some roads on Kauai and stopped traffic on the flooded Hanalei bridge.  

Kona storms like this typically occur 2-3 times a year and according to Kona Low expert, Professor Steve Businger of the University of Hawaii, they are often poorly forecast.

I am seriously thinking of planning some trips to Hawaii to work on this important problem 😋😁


March 16, 2020

The Weather Sensitivity of the Coronavirus: Good News in the Long-Term?

Will the coronavirus decline as summer approaches?   

What is its sensitivity to temperature, humidity, solar radiation and other factors?

There is some scientific literature on this topic and more is being submitted.    I will summarize a few of them below, but let me give you the bottom line:  it appears that warm temperatures and high humidity is bad for the virus (or similar viruses).  Also ultraviolet radiation from the sun is problematic for the virus.  Thus, in many populated locations in the northern hemisphere, the virus will experience a less favorable environment.


A recent submission to the journal SSRN by Sajadi et al. (Temperature and latitude analysis to predict potential spread and seasonality for COVID-19 ) suggests for the coronavirus there is

 "significant community spread in cities and regions only along a narrow east west distribution roughly along the 30-50 N corridor at consistently similar weather patterns (5-11C and low specific and absolute humidity)."

According to the Sajadi et al paper, the regions of major community spread has been characterized by average winter (November-March) temperatures of 5-11C (39-52F) and relative humidities of (47-79%), which they suggest is consistent with the optimal values of viral spread on surfaces for similar coronaviruses (4C and 20-80%, found in another paper, Casonova et al (2010)

These are exactly the kind of temperature/relative humidity values experienced in Seattle the past several months (see plots below for SeaTac Airport).


Sajadi et al.  goes on to note that there has been a lack of significant community transmission in regions that are warm and humid.  One of their compelling figures shows the location of major regions of community spread of COVID-19 (black circles) compared to near-surface temperatures (at 1000 hPa)--see below.

From Sajadi et al. 2020

Major coronavirus outbreaks have avoided the tropics and the summer (southern) hemisphere and seem to prefer a certain temperature range within roughly 20F above freezing.  Really cold environments do not seem favorable.

Their claim is supported by a recent figure which shows the number of cases around the world (see below),with few cases in the warm, humid tropics and the southern hemisphere.

Image acquired here:https://experience.arcgis.com/experience/685d0ace521648f8a5beeeee1b9125cd

And even in the U.S., a plot of the cases (courtesy of the NY Times) shows lots of cases over the Northeast and Northwest, where temperatures/humidities have been favorable, but far fewer cases in the southeast U.S.

Compare this occurrence map with the temperatures for the past 30 days (courtesy of the NOAA Climatic Data Center).  The light brown colors are in the favorable range:  the major metro areas in those colors (Seattle, New York) are the ones being hit hardest.  The warmest areas in the southeast have had relatively few cases.


Another major challenge for viruses like coronavirus is ultraviolet (UV) radiation from the sun, which has been demonstrated to inactivate them (one paper is here).  Solar radiation (and thus UV radiation) will increase rapidly across the U.S. during the next few months as we approach the summer solstice and skies progressively clear as the midlatitude storm track moves northward.

Many coronaviruses display a notable seasonal cycle (less in summer), which is consistent with the above (check here for a good description of the seasonal issues), but there are still many unknowns.

All said and done, there is good reason to expect that the summer, which will bring much warmer temperatures, much more ultraviolet radiation, a greater tendency for folks to be outside, and very humid conditions over the eastern U.S., will aid in reducing the current coronavirus outbreak.  Let's hope so.

March 15, 2020

Washington State Leadership in Dealing With Coronavirus

Washington State has immense resources to apply to the coronavirus crisis.

One of the leading university medical centers in the world.
Major biotech firms and a huge foundation dedicated to health science (Gates Foundation)
The world's leading logistics and delivery firm (Amazon).
One of leading brick and mortar food and supply firms (Costco)
World-leading software and machine learning firms and expertise (e.g., Microsoft, Amazon)
One of the leading tech centers in the world.

Our state has intellectual, scientific, technological, and financial resources equivalent to those of many nations.

Might we take a leadership role in tackling this crisis, not only for ourselves, but for the rest of the world as well? 

Could Washington State lead the nation in heavily investing in a complementary approach to social distancing, online learning, and sending people home from work?    Might Washington State fill the void left by an ineffective Federal response?

Importantly, could the current environment of despair and fear, be replaced with a more empowered one?

Imagine the following path in the future.

One in which local businesses and academic, put state capabilities on an immediate "war footing" to address the threat.

On March 18th, The University of Washington and major regional biotech firms, with the financial support of the Gates and Bezos foundations, announce that they will rapidly build the capacity to provide 100,000 tests a day for the coronavirus in Washington State, with results available within hours.  This includes the purchase of several Roche cobas 6800 systems that will have the capacity of processing over a million tests per month.  Such testing capacity is expect to be in place by April 10.

Governor Inslee announced on the same day that the test will be immediately available to all doctors and hospitals and that 50,000 test per day will be dedicated to random sampling of state residents.  Testing at this level began on April 3rd.


Governor Inslee noted  that anyone with a positive test will be experience mandatory quarantine.  He further noted that a new state fund will cover the salary of any quarantined individual.

"South Korea showed that potential of coupling massive testing with quarantine, and we will take this approach to a new level", announced the Governor.

The Governor also noted that all skilled nursing and other retirement communities will require all patient and caregivers to be tested, as will all visitors. " We must take all steps required to prevent our most vulnerable citizens from being exposed to this threat".

Jeff Bezos, leader of Amazon, announced on March 17th that Amazon would deliver food and other necessary supplies without delivery charge during the next 30 days.  "We will extend this offer, if the situation does not resolve itself," said Bezos.   "And considering that many people are home-bound, we will make all content on Amazon Prime freely available to the general public.  Amazon runs the biggest supply chain system in the world, and we will use it to assure food and other supplies will reach all home-bound" patients", said Bezos.


Costco also joined the effort, with a temporary program of no-cost delivery and the new ability to pre-order and pick up orders outside of any warehouse.  "No Costco shopper need to enter a store to purchase any of our products", noted Costco CEO W. Craig Jelinek.

A major issue had been the relatively simple modeling used to predict coronavirus spread and deaths, and their relative poor performance.   On March 16th, a joint effort between the University of Washington, the Gates Foundation, and the data analytics groups of Microsoft and Amazon was initiated to produce state-of-science predictive modeling for coronavirus by early April.   "

Microsoft has huge capacity in predictive analytics and machine learning, with particular expertise in the medical area.  Coupled with the expertise of the University of Washington and others, we will build the capability to more skillfully predict the trajectory of COVID-19 using the increasing volume of data assets" explained Microsoft CEO Satya Nadella.


By June the effects of massive testing and quarantine, coupled with the isolating of the most vulnerable elderly and infirm as well as social distancing, resulted in a significant decline of new cases, with regional loss of life in Washington State far more limited than initially expected.   The beneficial role of  warmer weather and contribution of the large pool of now-immune young people who had mild or little symptoms may also have been important in lessening the impact of COVID-19.

Addendum:  Why Massive Testing of the Population is How We Get Out of This

Social distancing may be a useful, short-term stop gap, but in the end something more effective is needed.   Social distance can buy time, but it is essentially kicking the can down the road, and society can not keep it in place for long without undermining its ability to function,  Economic activity will collapse.

The key aspect of social distancing is to prevent large portions of the population from getting in contact with an infected individual.  It does this by shutting down all avenues of interaction and gathering.    It is a blunt tool with significant negative impacts (e.g., cancellation of schools or degradation of teaching). 

Far better to use a more precise tool:  massive testing.   Find the infected individuals and take them out of circulation.  Much more effective and less damaging.  This allows society to function, but it requires the ability to give  tens of thousands of tests per day or more, something that is technologically well within our reach. 

Another issue with social distancing is that you can never cut off interactions completely--leaving a continuous base of cases and as soon as you pull back the restraints, the virus can explode again.


Should I Let AI Write My Blogs?

I spend a lot of time thinking about and writing my blogs.   Could AI apps do the work for me?   Could any of you tell the difference? Well,...