December 30, 2014

Highest Pressures in Northwest History

I am always intrigued by all-time history weather records and it appears we are experiencing one right now:

The highest sea level pressure ever recorded at some northwest stations.  For others it is the highest December sea level pressure on record.

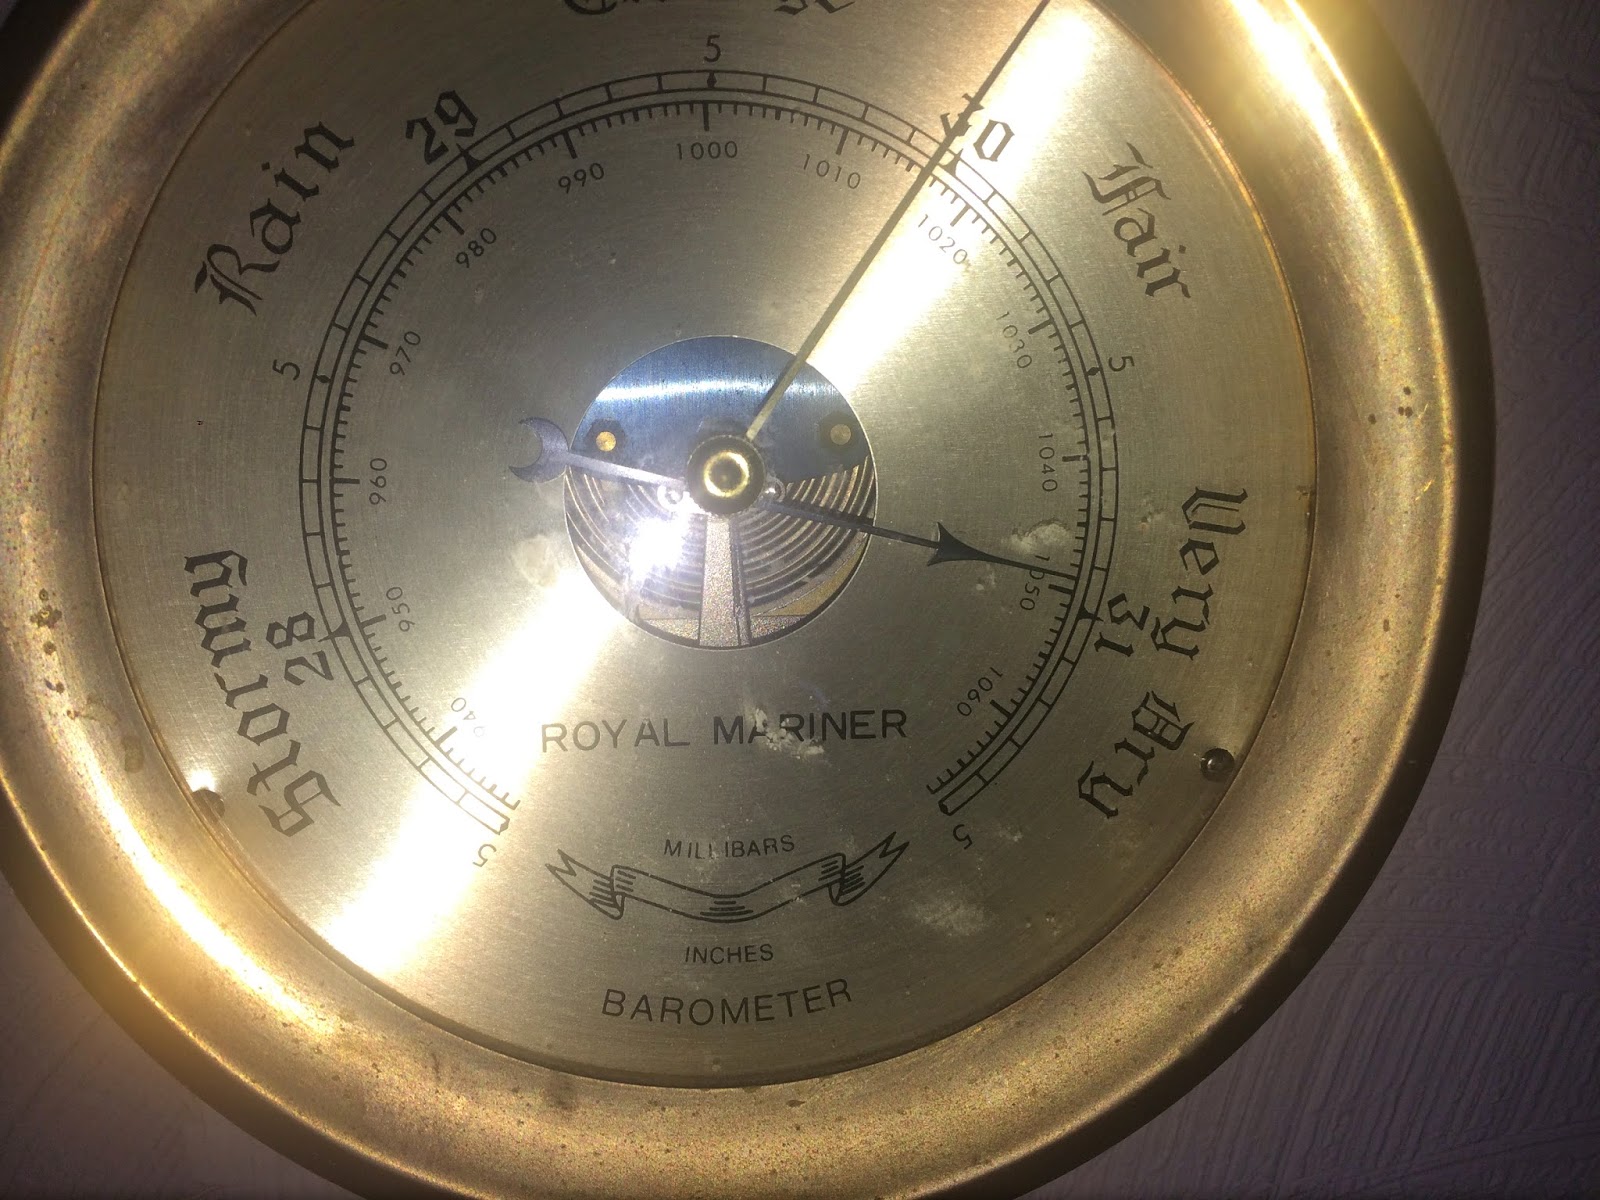
Some folks are complaining about strange sinus pain and headaches, among other maladies.  I know I am feeling a strange tightness in my head.

And the pressure is still rising as I write this!


 Picture courtesy of John Thoreson

So what kind of pressures are we talking about?

At Seattle-Tacoma Airport this morning at 11 AM  the pressure reached 1045.5 hPa (hPa or hectopascals is a unit of pressure).   Another unit of pressure is inches of mercury (often used on TV).   In that unit, the pressure reached 30.87 inches.   Wow.

At the same time, here are some other amazing sea level pressures:

Bellingham                   1046.4 hPa
Whidbey Island  NAS  1046.2
Portland                        1043.9
Pasco and The Dalles   1048.9

Now let's talk about records, and keep in mind that average sea level pressure around here is approximately 1013 hPa.

Seattle's pressure this morning (1045.5 hPa) is THE ALL TIME RECORD FOR ANY DATE.   The old record was 1043.1 hPa set on December 1, 2011.
(The period of record goes back to 1948)

Astoria breached its ALL TIME SEA LEVEL PRESSURE RECORD by climbing to 1042.9 hPa or 30.80 inches.   The old record was 30.74 inches.

Many locations have reached their all-time December records (such as Portland, Yakima, and Walla Walla)

To get some perspective on the pressure distribution, here is the official National Weather Service analysis at 7 AM.  Their analysis shows the highest pressure (1056 hPa)  high in British Columbia.    The highest pressure EVER observed ANYWHERE in the continental U.S. was 1064 hPa on December 24, 1983 at a location in Montana.


To give you an idea of how unusual this pressure is, take a look at the plot of sea level pressure at Seattle Tacoma Airport for the last 12 weeks.  Nothing even close to what is happening now.

Why is the sea level pressure so high?  

We start with a strong ridge along, as illustrated by the forecast upper level (500 hPa, about 18,000 ft) map at 10 AM (see below).   The solid lines are heights (like pressure) and colors are temperature.  You can see a high-amplitude upper-level ridge extending over the northwest.


This kind of pattern is conducive to the movement of cooler air over our region (northeasterly flow).   Cool air is more dense, so that increases the pressure even more.   To show this, here is the 850 hPa (about 5000 ft) heights and temperatures (color shaded).  The purple and blues indicate cool air.


So this pattern got everything right:   high pressure aloft and cool air near the surface...both leading to high sea level pressure.

For those who are suffering from the high pressure there is a cure....drive up into the Cascades or up one of our local hills.  Pressure drops about 1 hPa every 8 meters.  Even taking the elevator up the Columbia Center Tower or the Space Needle will help.  But some warning.  Some folks get headaches, sinus pain, and arthritis flair ups when pressure drops rapidly!
December 28, 2014

A Dramatic Double Convergence Zone

Western Washington residents are quite familiar with the Puget Sound convergence zone, a band of clouds and precipitation that forms east of the Olympics during westerly to northwesterly flow.   But there can be other convergence zones downstream of regional terrain barriers, such as the mountains of Vancouver Island.  

This morning, conditions produced TWO convergence zones at the the same time, one extending southeast of the Olympics, the other Vancouver Island.   Pretty dramatic stuff.  Here are two radar images to illustrate (thanks to Andrew MacMillen for pointing this out).

First, a regional view from the Camano Island radar at 4:44 AM.  Two bands are clearly evident.


And a close up view at 4:53 AM with terrain. Amazing image.  The northern line forms downstream of Vancouver Island, with precipitation become quite intense from Port Townsend to Lynnwood.  The second line, downstream of the Olympics, is weaker and reaches across Seattle.  


As with many convergence zones, precipitation extends into the western slopes of the Cascades.  In fact, Steven's Pass ski area got a piece of this, with their base snow increasing to nearly 40 inches (FINALLY!).  I hear their upper lot is already full.

Convergence zone precipitation is enhanced when air is unstable at low levels, often when cold air passes over the relatively warm water of the Pacific.  The convergence zones have dissipated now, but the 10 AM visible satellite picture shows the instability clouds off the coast--you can even see their NW-SE orientation, which is parallel to the low-level wind.


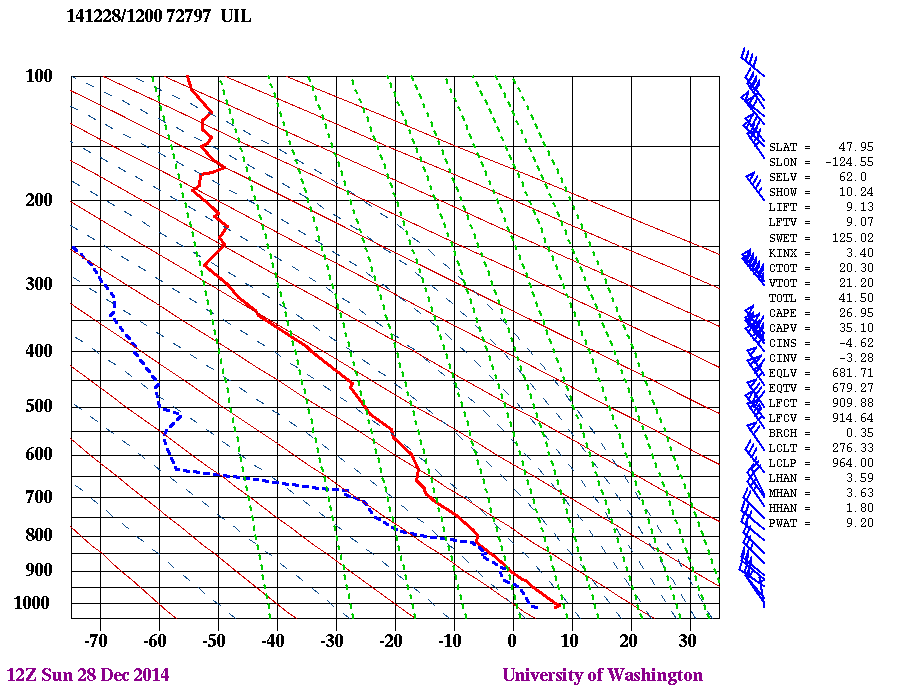
A radiosonde sounding on the Washington coast at Quillayute shows the strong northwesterly winds that approached the coast during the double convergence zone (height in pressure is on the y axis, with 500 about 18,000 ft.).  This plot also shows temperature (read) and dew point (blue dashed) with height.   A moist lower layer near the ocean (temp and dew point are nearly the same) and dry air aloft.


Strong northwesterly flow tends is favorable for producing a convergence zone extending downstream of Vancouver Island, since the island is oriented this way.  The more circular Olympic mountains allows convergence zones from a greater variety of directions.

And forget about convergence zone or any other precipitation the next few days, as a ridge of high pressure builds over Washington.  Enjoy the sun.    A special New Year's gift for us.

December 25, 2014

Is Numerical Weather Prediction One of Mankind's Greatest Achievements?

Mankind has achieved some marvels during the past several thousand years, from landing on the moon and the construction of the pyramids to modern computers and genetic engineering.    But perhaps weather prediction, and particularly numerical weather prediction, deserves to be in the Pantheon of the highest achievements of our species, and this blog will explain why.

Landing a man on the moon, was in many ways, a less impressive 
achievement than modern weather prediction.

Modern weather prediction is perhaps the most cooperative activity of our species.  To forecast the weather anywhere on the globe require weather data everywhere on the globe.   A disturbance over China today, can be over the U.S. in a few days, and vice versa.   Even during the cold war we shared data with China and the Soviet Union.  Nearly every nation exchanges its weather data with others, with few exceptions (like North Korea).


Modern weather prediction requires the ability to simulate atmospheric effects on a vast range of scales ranging from the molecular to the planetary.  To predict the weather one must deal with the condensation of water vapor on microscopic particles less than a micron (millionth of a meter) in size on one hand to planetary circulations of many thousands of kilometers on the other.

Modern weather prediction uses the world's most powerful computers and the associated model software includes millions of lines of code.  Some of the biggest computers in the world are used for weather/climate simulation.  For example, the UK Meteorology Office just purchased a 16 petaflop computer from CRAY (a petaflop is a thousand trillion operations per second).

Seattle's CRAY Supercomputers have become the hardware of choice for leading numerical weather prediction efforts

The number of lives saved and the economic value of weather prediction is beyond measure.  Superstorm Sandy hit the NY Metro area, home of tens of millions of people, with hurricane-force winds and major coastal flooding.   Roughly 150 lost their lives and many of them did so because they ignored the forecasts.  A similar storm hit a far more sparsely populated area of eastern Long Island in 1938 and over a thousand people perished. In 1900, a hurricane hit Galveston Texas and 6000 people died.  Weather prediction is now an essential tool for farmers and for those that manage our dams and roads, to mention only a few applications.  And if the weather becomes more extreme under global warming, improved weather prediction will play a large role in protecting life and property.

The amount of data collected for operational numerical weather prediction is staggering.  Petabytes of weather data are streaming to earth from dozens of weather satellites each day. Hundreds of thousands of surface stations, roughly a thousand radiosondes, thousands of ships and buoys, thousands of aircraft, lightning detection networks, and other sensors are reporting each day, adding up to tens to hundreds terabytes of information daily.   All this data is distributed around the world, quality controlled, and used to provide a physically consistent description of the three-dimensional atmosphere.
A NOAA Polar Orbiter Weather Satellite

Modern numerical forecasting went from non-existent in 1950 to highly skillful today.  The following chart is my favorite.  It shows increasing skill at 3, 5, 7, and 10 days at 500 hPa (about 18,000 ft) at one major forecasting center (the European Center, ECMWF).  Major increases in skill at each time projection (up is better). But even more impressive is the fact that southern hemisphere forecast skill (the lower lines for each color band) now equals to the northern (which has much surface and upper air observations).  The major reason:  weather satellites


So during this end-of-year season it is good to reflect on how far we have come in weather prediction, even though we have the potential to push the science and technology much further.  And we should not forget the dedicated folks that developed the models, the scientists/engineers that designed the satellites and observing systems, and the human forecasters that interpret and communicate the model output.   A huge and expensive enterprise that is worth the investment.  And one that has been been a successful partnership between the government and private sectors.

The media spends so much time highlighting what is wrong with society. But sometime we should think about our great positive achievements, particularly those dependent on the active positive cooperation of mankind.  Weather prediction surely is one of them.


December 23, 2014

Goodbye Hawaii, Hello Ridge

During the past weeks, the Pineapple Express has been running in one way or the other, bring warm, moist air to the West Coast.  The atmospheric moisture forecast for 1 PM (below) shows the story, with a stream of large moisture content heading from the islands to our region.  This warm air has not been good for the local ski areas, many of which have opened with marginal conditions.


The last two weeks have been extraordinarily warm, with the minimum temperatures of most days falling to roughly the average maximum for the day.  Here is the departure of the average temperatures from normal for the last two weeks for the western U.S.   Amazing.   Quite a few places have been 12-15F above normal, particularly in Idaho and Montana.  But Washington and Oregon have many areas 4-8F above normal.

The West Coast has been wetter than normal, particularly California, where many locations received 200%+ of normal precipitation.  The good news is that the big reservoirs like Shasta  have begun to fill.

Here is the Mt. Shasta reservoir levels....big upswing (dark blue line), but still below normal (blue shading).


But the big weather story for the Northwest is the major regime change that is about to occur, with a major ridge developing over the eastern Pacific bring drying and cooler temperatures.  To illustrate, here is the upper-level flow forecast for 4 PM on Friday.  BIG RIDGE.  And one that will bring cooler air into eastern WA, Montana, and the central Plains.  We will finally be cut off from the Pineapple Express.


Take a look at the Climate Prediction Center 6-10 day temperature forecast.  Blue indicates colder than normal.
Regarding snow, there will be some snow in the mountains at the tail end of the current event (see graphic), but after that the ridge will have its impact, drying things out.   Enough to allow local ski areas to stay open until they get a real storm.


December 21, 2014

Desperate Ski Resorts Taking Matters into Their Own Hands

I never thought it would come to this...but it has...PINEAPPLECIDE.

Northwest ski resorts are desperate to deal with their nemesis:  the Pineapple Express.

You know what I am talking about...the current of warm, moist air that brings warm temperatures and heavy rain to the West Coast.   The generic name for such features is atmospheric river, but in our region we call it a pineapple express since our atmospheric rivers generally have their roots near Hawaii (see graphic).

But during the last week, faced with potential closure over the profitable Christmas break, some Northwest ski operators have turned to severe and unprecedented measures to deal with the threat. Hearkening back to approaches more appropriate to shamans or voodoo witch-doctors, crazed representatives of various Northwest skiing organizations are shooting, decapitating, and sacrificing pineapples in a display of desperation rarely seen in our region.

Below is  a video of the carnage, one not appropriate for the squeamish or those under 18 years old.


Meteorologists generally oppose such interventions regarding unwanted meteorological phenomena, but with recent attempts idealized in popular movies (e.g., Sharknado I and II), one can hardly fault the Northwest ski industry for taking matters into their own hands.   I will be the last person to criticize them if they succeed in bring back bountiful snow to our mountains.

Anti-pineapple video games are starting to appear.


And even some foreign governments, concerned about Northwest production of apples, hops, and other food imports, are getting involved, although the measures they are calling for might not be effective.


December 20, 2014

Seattle in the Rain Shadow

Central Puget Sound residents do not frequently think about living in a rain shadow, like their friends in Sequim and Port Townsend.      But more frequently that you might expect, Seattle IS in a rain shadow and this will happen later today.

Seattle, with roughly 37 inches a year in annual precipitation, is far drier than the Washington coast, even places away from any terrain. For example, Westport, on the central Washington coast, gets about 74 inches....about twice a much as Seattle. The Long Beach Peninsula gets 81 inches.

The Puget Sound rain shadow is so profound that Seattle gets less rain than Chicago, New York, Washington, D.C. or Miami.

Our rain shadow is most evident when the winds along the coast are westerly (from the west), because of their interactions with the Olympics.


When the winds are from the west, air rises on the western side of the Olympics (producing heavy rain) and descends on the eastern slopes (causing drying).

During the past few hours (Saturday AM), a warm front has passed through our area  (sorry skiers), bringin warm air and a shift to westerly flow.  To illustrate this, here is the forecast heights, winds, and temperatures (shaded) at 850 hPa (about 5000 ft) for 4 PM Saturday (today).  The wind are parallel to the height lines and the closer the lines are together, the stronger the winds.  What you see is very strong westerly flow surging into our area, with red colors indicate very warm air.   You can get strong Puget Sound rain shadow with such a pattern, as well as heavy rain on the western sides of the coastal mountains and the Cascades.

 This air is also very moist, something suggested by the 10 AM water vapor product from satellite data (see below).   We have an atmospheric river today, with a narrow streamer of moisture extending from the tropics into our region.
 Now the fun part.  Here is the predicted rainfall for the 24h ending tomorrow (Sunday) at 4 PM PST. Wow...heavy precipitation in the mountains (as much as 2-5 inches) but a very strong rain shadow from Seattle westward over the Kitsap.   Only a few hundredths of an inch in some places.


Here is a radar image around 6 PM for the Seattle area.  A beautiful example of rain shadowing east of the Olympics!


What I like about this flow direction is that Sequim is way wetter than Seattle.  What I don't like is that there will be a lot of warm rain falling on the limited snow in the Cascade.  Stevens Pass opened for limited skiing today, with a 17 inch base.  Baker opened as well.  Bring old skis.


December 18, 2014

Northwest Warmth Continues

We can't seem to shake the above-normal temperatures.  Here is the temperature anomaly for the last month.  Virtually the whole western U.S. is warmer than normal, with particularly anomalous conditions in southern Idaho and Wyoming.

Looking over the past four weeks at Seattle and Yakima shows almost an identical story...except for the one cold-spell in late November/early December, the temperatures have been above normal, with low temperatures often falling to the average highs for the day (red lines are average highs, blue lines average lows)
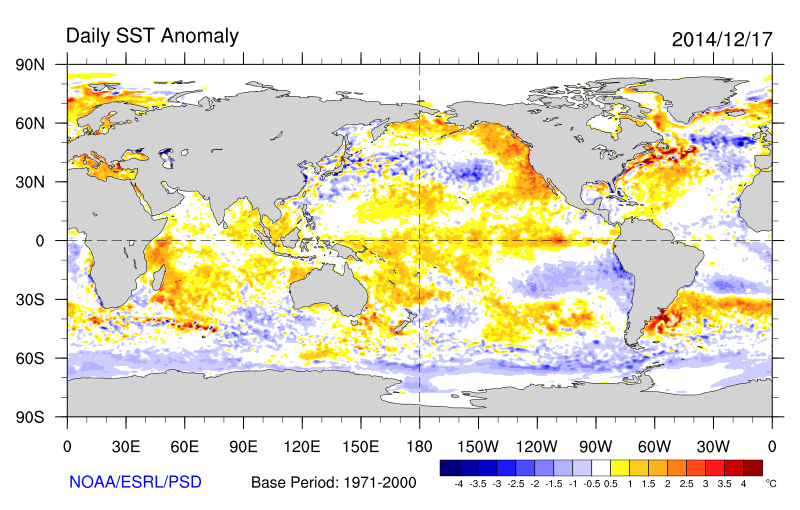
The main cause of the warmth has been the unusual persistence of warm southerly and southwesterly flow, but the unusually warm water off our coast has not hurt (see graphic, which shows the sea surface temperature anomaly yesterday.  Red areas are considerable above normal).


A strong ridge will build over the region over the weekend (see upper level map for 10 AM on Monday).

And this kind of  flow brings warmth and moisture into us. Take a look at the total precipitation for the next 72 days.  5-10 inches over some locations in the coastal mountain and Cascades.  Northern CA will get a piece of this, which is very good.  But not good for our snowpack.

But some good news...colder air make get here by the 24th, so that the mountains may get a bit of snow by Christmas.

December 16, 2014

How the Grinch Stole Northwest's Christmas Snow

We are now getting close enough to the holiday season to make an unfortunate forecast:  there probably will not be enough snow for Cascade mountain skiing during this holiday season in WA and OR.   As we will see, a major grinch will be a strong atmospheric river that will develop next week.

We start with a very poor snowpack in place.  Here is the % of normal snow water equivalent (SWE) in the western U.S. mountains. The western Cascade slopes are now 15-20% of normal.  The Olympics are 23%.  A bit better in the north Cascades and the eastern slopes, but still considerably below normal. With the recent precipitation, the California Sierra are doing much better....a nice turn of luck for them!

The NW Avalanche Center summarized the snow situation (snow depths) at some major ski areas (see below).  Mount Baker is 9% of normal, White Pass has NO SNOW,  Crystal has 6%, and Stevens has 25%.  We are way worse off than last year, which was not a good year.  6 out of the 11 sites have ALL TIME RECORD minimum snow for Dec. 15th.


So we start off with a sparse snowpack.  Next week a major ridge of high pressure builds over the West Coast.   Here is temperature anomaly (difference from normal) for the NCEP ensemble mean at 850 mb (around 5000 ft) for Monday December 21st at 4 PM.   Warmer than normal (orange colors).


The Climate Prediction Center (CPC)'s 6-10 day forecast for December 22-26th continues the trend with warmer than normal in the west.


A major issue is that a major atmospheric river will form over the weekend.  Warm, moist, air with heavy rain over Northwest mountains.  Here is the vertically integrated water vapor content prediction for Saturday at 10 PM.  Very juicy (red and white indicates the highest values).  There will be more flooding...guaranteed...bad for snowpack.


What about snow this week?  Let me snow you the UW WRF model totals for the next two 72 hour blocks.   First, 72h hours, perhaps 3-6 inches in the WA Cascades.


Next 72 hour, up to a foot in the north Cascades, but not much south of Snoqualmie.  Much more in the mountains of SW BC.   Whistler will be in better shape,


The trouble is that we won't get that much snow this week and then that snow will be hit hard by the heavy rain and warm temperatures.  Sorry.

December 14, 2014

The Oregon Coastal Radar Gap

It was 10:30 AM on Thursday morning and the forecast models predicted that a deep low center from a Pacific storm was moving up the Oregon coast.    For meteorologists, it was crucial to know exactly where the low was located, both to check the model forecasts and to improve upcoming model runs. The visible satellite image was not definitive, with an elongated trough and no clear circulation evident.   But the models were emphatic it was off the coast somewhere.  But where?


What did the National Weather Service weather radars show?

The new Langley Hill radar on the Washington Coast was too far north, since the low was probably off the southern/central Oregon Coast.  It did not show a circulation, since it was too distant.


The Portland radar, too far from the ocean and the lower beam blocked by the coastal mountains, showed practically nothing offshore.  We see this problem all the time--the Portland radar is not very useful for viewing coastal or offshore weather.


The Medford, Oregon radar, too far inland and too high (it is on top of Mt. Ashland at around 7500 ft) showed little offshore.   No help at all over the ocean.

Putting all the radars together in a composite, there is little evidence of the circulation around the low...or anything else off of Oregon.  Not good.

Four hours later, when the the low center was further north and in the range of the Langley radar, the swirling circulation around the low was evident.  But for critical hours we did not have a good fix on the low.


The problem?    A huge gap in radar coverage over the Oregon coast and coastal ocean west of Oregon.  Here is an official National Weather Service radar map that shows the problem.  As I mentioned in a previous blog, there is also a major gap in coverage on the eastern slopes of the Cascades,

Since storms often come from the southwest and west, that means a major metropolitan area (Portland) lacks proper (or any) radar coverage upstream.   And as illustrated with the storm this week, it hurts western Washington forecasting as well, but at a more extended time range.  The lack of radar coverage off of the Oregon coast is something that Portland TV meteorologist Mark Nelsen has been blogging about repeatedly.  He knows.

The lack of a coastal radar is a particular problem today, since the National Weather Service forecast systems, like the new High Resolution Rapid Refresh (HRRR),  assimilates all U.S. radars before they make their forecasts.   That means that the radar information is used to describe the atmosphere, which greatly improves the forecasts.  I have noticed that the HRRR often gets offshore structures that are only described by the Langley radar.  Imagine if we had a similar radar on the Oregon coast!

As we learned with the acquisition from the Langley Hill radar near Hoquiam, the National Weather Service will not fix this problem without intense local lobbying.  I tried contacting the Oregon congressional delegation, but they were not interested in talking to someone from out of state. Oregon State residents, businesses, and organizations need to work together, in concert with their congressional representatives, to make the case for an Oregon coast coastal radar and to push for its acquisition.

A Major Cyclone Will Approach Our Coast But Not a Repeat of November 19

A very strong, rapidly developing, midlatitude cyclone will approach the Northwest coast on Friday and move through on Saturday. Fortunately...