March 31, 2022

Where Would a Toxic Release over Ukraine End Up? The Pacific Northwest Would Be In the Downstream Plume

 Several blog readers have asked me about the impacts of a toxic release over Ukraine.  Where would it go?   Could the Northwest be in the line of fire?

We are talking about the fallout from a nuclear device, leaking radiation from a damaged nuclear plant, or toxics associated with chemical or biological weapons.

To explore this concern, I created air trajectories--showing the three-dimensional path of air parcels-- starting over Ukraine at three levels (6000, 7000, and 8000 meters above sea level).  This corresponds to 20,000 ft, 23,000 ft and 26000 ft ASL).  This work was done with the NOAA online HYSPLIT model and assumed the "event" occurred today at 11 AM and traced the trajectories for 240 hours.

My mouth dropped when I saw the plot:  the two lower trajectories went right over Washington State (see upper panel below).


But it is worst than that:  the lowest trajectories descended towards the surface in the latter half of their travels.

The trajectories shown above would certainly be altered if another time was used.  But the message is clear:  the atmosphere is interconnected, and with generally westerly (from the west) winds in the midlatitudes, any injection of toxic materials will spread around the globe.


March 29, 2022

A Super Jet Stream Will Cross the Pacific this Weekend.

If you want to take a very fast flight across the Pacific from Tokyo to Seattle, book your ticket on Sunday.

Normally, such flights take about 8.5 hr.   But Sunday you will do it in well under 8 hours..perhaps as short as 7.5 hr--and I suspect the route will be more direct than normal.

The reason: a nearly continuous, strong jet stream across the Pacific.

As a reminder, a jet stream is a relatively narrow current of strong winds in the upper troposphere and lower stratosphere, typically found between 25,000 and 40,000 feet above sea level.

To illustrate, here are the predicted winds (in knots) at around 38,000 ft (200 hPa pressure) at 5 PM PDT Sunday..  Reds and browns are the strongest winds-- with the most energetic winds of 150-175 knots (175-200 mph)


A balloon released from Japan could make it across the Pacific (roughly 4700 miles) in roughly a day in a half.  

The jet stream is the locus of clouds and storms and a map of predicted cloudiness (simulated satellite image) for 5 PM PDT Sunday shows the continuous ribbon of clouds across the Pacific.


To have some fun, I used the NOAA Hysplit system to calculate three-dimensional air trajectories, tracing the previous path of air reaching over Seattle at 3 PM Sunday at 8000 meters and 10,000 meters above sea level (see figure).  I plotted the air trajectories over the past 60 hours.  

The over Seattle on Sunday will have come from Japan!


From Mount Fuji to Mount Rainier in about 50 hours. And before that North Korea and Russia.

The airspace of our planet is very interconnected..... something we should never forget.


March 27, 2022

The Beauty of Atmospheric Water Vapor

Meteorologists have no need to purchase artwork.

The reason is that imagery from satellites, radars, and numerical models is often stunning.  

Let me show you an example:  water vapor imagery from weather satellites.

Most of the satellite imagery you see on TV and the media uses wavelengths that DON'T show you the atmosphere.  Visible satellite imagery shows you how much solar radiation is reflected off clouds and surface.  Infrared satellite imagery tells you the temperatures of clouds and surface, based on how much radiation they emit.

But there are exceptions to this situation, and the most important is wave vapor imagery that displays the amount of radiation emitted by water vapor in the atmosphere.  Where the imagery is white, that means a great deal of moisture is in the upper troposphere (roughly 20,000-35,000 ft), where temperatures are relatively cool.  Dark shades indicate little upper-atmosphere moisture and plenty in the lower atmosphere.

We are ready....let's look at atmospheric art.  

Below is the water vapor image from Friday afternoon over the northeast Pacific.  Two beautiful swirls are evident....both associated with mid-latitude cyclones (low centers).  The dry dark areas are where dry air is sinking down behind and into the low centers.

Massive white areas to the east of the storms are associated with very moist, rising air.


Next, some tropical water vapor imagery on Saturday.  You can see tropical waves modulating the water vapor, with a huge striated intrusion in the lower southern portion of the image.  Stunning.  A weakening storm (swirl) is noted to the northeast.


Finally, let's look at the entire hemisphere. You an see the swirls associated with storms in the midlatitudes of both the northern and souther hemisphere.   But what REALLY sticks out are the bright light blobs in the tropics, associated with tall tropical thunderstorms.


So water vapor imagery is very pretty.   But there is much more.  Modeling output can be stunning..... such as the surface temperature forecasts for the UW WRF model (see below).


Someone should start an online weather gallery....perhaps a potent business idea.


March 25, 2022

How far into the future are weather forecasts skillful? And the weekend forecast.

 My new podcast addresses a question I am often asked.  How far into the future are weather forecasts skillful?  

The answer has changed radically during the past three decades and I tell you why.   Just to motivate the discussion, here is a plot of the skill of the National Weather Service global model (GFS) for various lead times (blue bar).   The skill holds up well for the first four days, but you see a big drop during the second week.   This plot also shows the skill of ensemble systems in which many forecasts are made and averaged: the skill holds longer.

My podcast also provides the weekend weather forecast and tells you where you can drive to experience the mid-70s!  See below on how to access the podcast.


Some major podcast servers:

 HTML tutorial HTML tutorial
Like the podcast? Support on Patreon 


Announcements


With COVID declining, the department is starting public lectures, and the first one is a very good one (see below).  You must register to attend.
April 7, Thursday, 7 – 8:30 p.m.Sign up for event 'Peter Hobbs Endowed Lecture "Staring Into the Fire: Using Observations to Understand Wildfires and Smoke" - Assoc. Prof. Emily Fischer, CSU' or here.
Location: Kane Hall (KNE)
Campus room: 110

Staring Into the Fire: Using Observations to Understand Wildfires and Smoke

Recent increases in western U.S. wildfire activity have made wildland fires and the associated smoke a significant challenge for society. This problem will only grow as the climate warms. I will discuss how the atmospheric science community has used both new in situ observations and operational datasets to answer important questions about wildfires and how smoke evolves in the atmosphere.

______________

And the Northwest Weather Workshop will occur (online) on May 7th.   Information is here.

This meeting is open to everyone and covers the big weather events of the year, plus much more.  The June heatwave will be a major topic this year!

March 24, 2022

Are atmospheric rivers a new meteorological phenonomon?

During the past year or so, whenever there is a significant precipitation event on the West Coast, the media headlines "atmospheric rivers."  

Ten years ago, hardly anyone talked about such rivers.  Now, they are mentioned all the time!

To illustrate the change, here is the google trends analysis of searches on "atmospheric river" from 2004 to today.  Before 2010, almost no one was searching for the term.  But this November, it was very, very popular.  The same thing is true of mentions in newspapers and online.

What has changed?

Several people have asked me whether atmospheric rivers are a new weather feature forced by global warming.

Others ask me whether global warming has made atmospheric rivers stronger and more frequent.

Well, it is time to "clear the air."   

The phenomenon now known as atmospheric rivers is as old as the hills.  They have NOT gotten stronger or more frequent on the U.S. West Coast, although they may in the future.

I should note that this topic is one I have published in the peer-reviewed literature and received Federal support (NSF) to study.

Atmospheric River 101

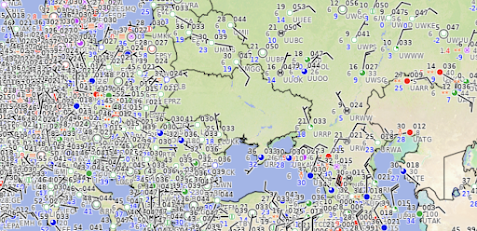
Atmospheric rivers are plumes of moisture (water vapor) that move into the midlatitudes from the tropics or subtropics.   They can be best viewed through weather satellite imagery sensitive to water vapor in the vertical.   

In the example below, the total amount of water vapor in a column is presented for a single time, with red and purple indicating the highest values, which generally are found in the tropics.  This makes sense since warm air can "hold" more water vapor than cooler air.  But look closely and you will see tendrils of water vapor extending into the midlatitudes.

These are atmospheric rivers and several are apparent at this time--which is NOT unusual.


The term "atmospheric river"  was first used in a paper by Zhu and Newell in 1994, with the title "Atmospheric Rivers and Bombs."  Bomb is a term used for rapidly developing mid-latitude cyclones.

They noted that rapidly developing low-pressure centers often have a filament of moisture associated with them.    They called these filaments "atmospheric rivers" because they move large amounts of water vapor, the equivalent of major rivers such as the Mississippi and Amazon.

The term "atmospheric river" was evocative and catchy, and the name rapidly entered meteorological parlance and subsequently was picked up by the media.  

The phenomenon of strong winds accompanied by large amounts of moisture was well known before 1994, but the names used, like the "low-level warm sector jet" were not destined to become household words.  Wonder why.

To illustrate some previous use of the idea under a different name, below is an old USFS figure showing a midlatitude cyclone and fronts:  I have added a red arrow to highlight the area of the strong, moist southwesterly flow that was described in the document.


Global satellite imagery showing moisture, which become available during the 1990s, provided impressive graphics of the phenomenon and helped in publicizing the feature.

But there was something else.  The advent of high-resolution numerical weather prediction provided very graphic pictures of what happens when atmospheric rivers hit West Coast terrain:  huge amounts of water vapor can be converted into precipitation as the strong winds and bountiful moisture of atmospheric rivers are forced to rise by coastal mountains.   

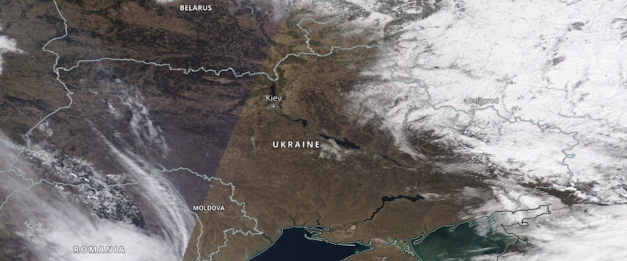
To illustrate here is an example from December 2010.  A long moisture plume (atmospheric river) moved from west of Hawaii to the Washington coast.


And the 24-h simulated precipitation was enormous: 5-10 inches in the mountains. Some atmospheric rivers have dropped twice that.


Atmospheric rivers provide substantial precipitation for the entire West Coast, from northern Mexico to southeast Alaska, with the percentage of annual precipitation associated with the rivers increasing to the south.

There is a deep literature and substantial observational evidence suggesting that during the past century there has NOT been a general upward trend in atmospheric river intensity and frequency on the West Coat.. 

 In some locations, heavy precipitation is up and some places down.   This was the conclusion of a peer-reviewed paper I published with Adam Skalenakis and Michael Warner (see graphic from the paper below, with arrows showing the long-term trends).  A number of other papers have come to the same conclusion (no observed historical trend in West Coast atmospheric rivers).  I will do another blog on observed heavy precipitation trends for the region and the future of atmospheric rivers.

Climate simulations do suggest a modest increase (10-20%) in atmospheric rivers by the end of this century if greenhouse gases continue to rise.  That increase, coupled with less snowpack, could contribute to increased flooding, particularly after 2050.


March 22, 2022

The Tactical and Strategic Implications of the Weather Situation in the Ukraine

Throughout history, weather has played a critical role in war, and thus it may be of value to review the past, present, and future weather situation in Ukraine to garner insights into the future of this terrible conflict.

Weather Conditions for Offensive and Defensive Operations

Cloudy, rainy, and low-visibility conditions generally favor defense, since offensive operations--from aircraft-based attacks, intelligence collection from aircraft or satellites, and artillery targeting--are undermined by stormy, rainy, or cloud-enshrouded situations.

February was drier and sunnier than normal over Ukraine, and was followed by a cool/cloudier period in early March.  During the last week anomalous high pressure has existed to the north of Ukraine (see upper-level map yesterday, below), producing warmer and drier conditions over the country.   This has been beneficial to Russia's offensive operations.


Upper-level (500 hPa, about 18,000 ft) maps, with the colors indicating how much the situation is different than normal.  Red indicates enhanced ridging (higher than normal heights/pressures), which is producing clear skies and warming over Ukraine. Ukraine is indicated by a blue star.

This situation--favorable for the Russians--will continue for another 3-5 days, but then there will be a major shift in the atmospheric structure with a deep trough of low pressure developing to the north (see forecast map for March 27).   Weather conditions will deteriorate over Ukraine, aiding the Ukrainians.


The European Center forecast of the simulated cloud image for Monday (March 28th) shows extensive deep clouds over Ukraine.

Monday March 28, Satellite Simulation. Courtesy of WeatherBell LLC

Temperatures will subsequently drop below normal and precipitation will spread across Ukraine (the 72h hour total precipitation ending 31 March is shown below).


In short, the weather this week will be favorable for offensive operations (and resupply missions) but that will change over the weekend.  Next week, obscuring skies and precipitation will aid defense.

"General Mud"

What about the situation on the ground?  As noted in a previous blog, and numerous accounts in the media, Ukraine, eastern Russia, and the adjoining areas are well known for very muddy conditions during the spring (as snow melts into poorly drained soils) and autumn (with the return of fall rain), while the hard-frozen soils of mid-winter and dried soils of summer (with dust) are favorable for military operations.   

Currently, snow has melted over most of Ukraine, except for the far eastern regions, as apparent in a visible satellite image yesterday and the European Center snow analysis (both below).

MODIS visible satellite image on Monday, March 21.  Snow is evident over the far northeast side of Ukraine.

European Center Snow Analysis on Monday

To gain some perspective on the situation, the precipitation situation in Kyiv is shown below.  There was no snow at the end of February (no data in March on this figure.).

Courtesy of Weatherspark

Here are the March observations at Kyiv from meteoblue.  Very little March precipitation and temps were too warm for snow for much of the month.


Compare this against a more typical year (2018), where the snow extended into March.

Snowmelt is ahead of schedule because of a warm, dry February and the warm/dry conditions of the past week.  

You can get an idea of where the snow has melted this year by looking at the visible satellite image on Feb. 13th (below).  Lots of snowmelt then over the northern part of the country compared to the image shown earlier.


_______________________

The bottom line is that the snowmelt over the northern portion of Ukraine was early this year and started with less snow to melt.  Little rain fell on the melting snow.   So if "General Mud" is helping slow down offensive armor and its support vehicles, it is happening now and will not extend into late spring as in more normal years.  

Russian Tanks Stuck in Mud 3 Weeks Ago


March 20, 2022

The Mid-March Precipitation Transition over the Northwest

Residents of the Northwest are a savvy group regarding precipitation, considering their considerable experience with the wet stuff.   

And the really precipitation-aware know about an interesting subtlety:  the late-winter precipitation plateau and the mid to late March transition over western Washington.  And the eastern Washington precipitation leveling during spring.  And more.


To illustrate, consider the climatology precipitation at Seattle Tacoma Airport, showing the probability of experiencing 0.01 or 0.10 inches of precipitation in a day.

The wettest period at SeaTac is from mid-November through early January, when the incoming storms off the Pacific are strongest and more frequent.  Then the probability of precipitation declines a bit in January, followed by little change through mid-March.  Subsequently, from the last few weeks of March through early May, precipitation significantly declines.   I call this the "spring drying."   

Interestingly, there is a bit of an uptick in Seattle's precipitation frequency in late May--at the beginning of the June Gloom period.  There are two reasons for this.  First, high pressure building over the eastern Pacific starts pushing more moisture into the region during that period, resulting in light rain.  Also, we can get some convection and thunderstorms during that period, as the stronger sun drives convective showers.  


This late-spring moist period is followed by the "big drying" in July that takes us to the desert-like conditions of late July and early August.

What about the rest of Washington State? 

Richland, in the arid Columbia Basin, has its peak probability of precipitation during late November--in the middle of the Northwest storm season.  In December precipitation starts to decline, with minor ups and downs, until early April.

But then something interesting happens.  The precipitation stops declining and levels off until early June.   Why?

The answer:  spring is shower and thunderstorm season over the Columbia Basin, as the increasing sun causes the atmosphere to destabilize--to start convecting.  Weak disturbances off the Pacific help provide some lift and initiate these showers. 

In mid-June, the ground has dried up substantially (less moisture available) and the disturbances of the Pacific become infrequent and weak.  The result is a sharp drop in precipitation during mid-June at Richland and vicinity.


The situation at Spokane is similar in Richland, except the winter peak is a bit later (very late December).


The subtleties of Northwest weather are always fascinating.  You start with variations in the storms and moisture coming off the Pacific.  Add to that changes in vertical stability and thunderstorms/convection as the temperature change with height changes by season.   Varying winds during the year alter the effects of terrain (windward enhancement/lee rain shadowing).  The precipitation story is complex and nuanced.


March 18, 2022

Are TV Weathercasters Meteorologists? And Another Atmospheric River Coming Our Way.

I am often asked about TV weathercasters.  Are they really meteorologists?  How good are their forecasts?      I answer these questions and more in my podcast.

Western Washington has been lucky to have exceptionally talented and knowledgeable TV weathercasters, such as Steve Pool (left) and Shannon O'Donnell (right)

And then this is ANOTHER atmospheric river coming our way later on Sunday.  Here is the forecast map of atmospheric moisture at 2 AM Monday.  The red and whitish colors indicate large amounts of moisture--headed our way.


The bulk of the moisture will hit the northwest part of Washington and southwestern BC as shown by the accumulated precipitation through 5 PM Monday.  Very wet on Vancouver Island!


More on the forecast in my podcast, as well as my discussion of TV weather.


Some major podcast servers:

 HTML tutorial HTML tutorial
Like the podcast? Support on Patreon 


March 17, 2022

Northwest Reservoirs and Summer Water Supply Are in Good Shape

After the Ides of March I generally start thinking about summer water resources, with the snowpack, reservoir levels, and predicted Columbia River flow utmost in mind.

The bottom line is that the state is in good shape waterwise for this summer.

The snowpack is a bit below normal right now---but not too bad at around 85% of normal for the State.


Considering the snow that will fall during the next week (see forecast below), we will be in good shape snow-wise going into the spring.

 
And then there are the reservoirs.   The most critical is the Yakima reservoir system that supplies water to a lot of agriculture around Yakima and Selah (see below).   Wow.  These reservoirs are in tremendous shape....WAY above normal.     So full of water that we are about 2-3 months ahead of normal filling.

Plenty of water for hops and tree fruit!


Seattle's reservoirs are slightly above normal, and would have been hugely above normal, if Seattle had not released lots of water to prevent the dams from overtopping (see below).


Another important source of water is the Columbia River and the latest forecasts(black line) is for it to be above normal (light green line) through at least mid-July,


I could show you more reservoirs or rivers, but the general conclusion is that the current outlook is positive for water supply this summer for Washington State, something expected after a La Nina winter.  California is not so good....which is typical for La Nina years.


March 15, 2022

Mud Season In Ukraine

The ongoing tragedy in Ukraine has a number of meteorological dimensions, some of which will be touched upon in this blog.

To begin, the war has essentially cut off surface meteorological observations over the region.  Below is the plot from a few hours ago.  Great density of weather observations over Europe....and even some over Russia....but virtually no weather data coming out of Ukraine.   Western Russian was pretty chilly...temperatures only in the teens (F).  


We are now coming into mud season over Ukraine and vicinity, mud that has the bain of intended conquerors for centuries.   As shown in the climatological temperatures for Kyiv shown below, March is a time of very rapid warming, which results in the rapid melting of snow.

                                                                   Graph courtesy of WeatherSpark

And  in late spring precipitation begins to increase as well (see climatological rainfall below)'


With warming temperatures, melting snow, and then increasing rain, Ukraine experiences an infamous muddy season during spring called  Rasputitsa (with another muddy period in autumn).  Heavy clay soils that inhibit drainage adds to the muddy woes of the region.

March-April 1942

Increasingly muddy conditions are a problem for invaders, working against travel in the many areas of Ukraine without paved roads.

The weather had been relatively warm and dry over Ukraine recently, and the latest high-resolution satellite imagery does not show much snow cover over the western 3/4 of the nation.


The latest numerical weather forecasts show very cold air over Russia that will continue to spread over eastern Ukraine for the next few days.

Surface air temperatures (°C) for 7 PM PDT on Wednesday.  Light green is the coldest temperature.

But warming is ahead (see weather.com forecast for Kyiv), which should be a relief to the embattled population of the region.    Unfortunately, that warmth will come with relatively sunny skies, which would be favorable for aircraft operations.


Should I Let AI Write My Blogs?

I spend a lot of time thinking about and writing my blogs.   Could AI apps do the work for me?   Could any of you tell the difference? Well,...