July 30, 2023

A Summer of Beautiful Cirrus Clouds

This has been an interesting summer in many ways, with a persistent offshore upper-level trough resulting in temperatures averaging a bit higher than normal, but with a lack of major heatwaves. 

But there is more.  The offshore upper-level trough has produced upward motion in the upper troposphere (roughly 15,000 to 35,000 ft) that has produced ice clouds.

These are cirrus clouds of various forms, and they are often very beautiful.  Let me share a few pictures with you.

Below is a picture taken last night near sunset.  Ice crystals are actually falling out of some of the cirrus clouds and bending back due to the weaker winds at lower levels.

These features are called fallstreaks.  Often called mare's tails.


Or if you want something really fancy, here is a circular cirrus cloud complex with a fallstreak in the middle.   Could be mistaken, perhaps, for a UFO.


By the way, one way you can tell you are looking at an ice crystal cloud is that the boundaries of the cloud are fuzzy and not sharp.

Sometimes cirrus forms in complex linear features:


And if there is enough change in wind speed with height, the cirrus can be distorted into wave-like features associated with the impressive-sounding name, Kelvin-Helmholtz instability:


What do cirrus clouds look like from space?   Here is a recent example showing lots of cirrus clouds over the South Sound.


Finally, this is one type of ice crystal cloud that is less frequent over western Washington than over the eastern half of the U.S.:  cirrus anvil clouds associated with vigorous thunderstorms.   I did catch an example of one associated with a thunderstorm over the Cascades (below).  You see the flat upper portion of the thunderstorm....that is the cirrus anvil.


Enjoy your cirrus viewing.

Reminder:  There is an online zoom session for Patreon supporters tonight!


July 28, 2023

A Summer Without Extreme Heat in the Northwest

With all the talk of heat waves in the media these days, it is fascinating to note that the Pacific Northwest has NOT had extreme heat this summer.  

No major heatwaves.   A lack of warm temperature records.

A really moderate, benign summer regarding high temperatures.  And the temperate weather is not over.

And more surprises...there is really little evidence over the past decades of increases in extreme July heat in our region.

Let me show you some data, to prove the above to you.

Just a reminder....the end of July is climatologically the warmest time of the year (see the climatology of SeaTac Airport, below).   By the end of August, solar radiation has declined so much that the temperatures inevitably decline. 


A July Without Extreme Heat

Below you will find plots of the highest temperature in July over many decades for five local stations:  Olympia and Bellingham in western Washington, Wenatchee and Kennewick in eastern Washington, and Portland, Oregon.  I have plotted the July highs for the entire period of record and plotted a linear trend line for your reference.

Really interesting.   The high temperatures in July at these stations have been very average and FAR below record levels.  

Most of you have not needed AC this month.


Perhaps Shocking to Some

Now look at the trend of the extreme July temperatures above (brown lines) and you will notice something that is perhaps surprising:  there are no large increases in record July temperatures over many decades.

About a 1°F increase at Bellingham and Olympia, roughly .5 °F at Portland and Wenatchee, and a DECLINE of roughly 2 F at Kennewick over many decades.

The background global warming of mean temperatures is about 2F.  Our regional extremes are going up LESS than that.  

There is no local amplification of extreme temperatures as the planet slowly warms.

To bring home the message of the lack of extreme temperatures this July, below are the temperatures at Olympia and Wenatchee (blue bars showing observed highs and lows), with record daily highs shown by the red colors.

No daily high-temperature records were broken.  None. Nada. Zippo.


Finally, the moderate temperatures are not over.  

To illustrate, the latest 7-day forecast from the European Center ensemble (shown below) indicates cooler than normal conditions (blue colors) over and west of the Cascade crest (this is for the daily average temperature, NOT the high temperatures).


As noted in my previous blogs, the lack of extreme high temperatures is associated with a persistent atmospheric circulation pattern.  It also helps explain the lack of wildfires over the region.

Announcement

I will have a special online session for my Patreon supporters on Sunday at 8 PM.  Will talk about local heatwaves and wildfires and answer your questions.


July 26, 2023

Huge Grass Fire in Eastern Washington: Was Drought or Climate Change a Factor?

A very large and fast-growing wildfire in eastern Washington burned through grass and range vegetation starting during the late afternoon of July 21st.   

Picture courtesy of Susan Stevenson

Called the Newell Road fire, the blaze expanded to roughly 60,000 acres just north of the Columbia Gorge east of The Dalles (see burn area below).


Some politicians and media outlets are claiming that this wildfire can be traced back to drought, which in turn was caused by climate change.   

For example, a Seattle Times today quotes Washington State Land Commissioner Hilary Franz:

“It’s really a testament to the drought conditions we’re experiencing as well as the fire danger"

followed by the article's author noting that:

 "The warm and dry conditions —exacerbated by climate change— are expected to continue through the summer. "

The facts are very clear that this fire had little to do with drought or climate change.  

It had everything to do with strong winds, human ignition, bountiful surface fuels, invasive grasses, and normal drying conditions.

Grass Fire 101

To get a big, fast-moving grass fire you need lots of dry, dead fuel (grass and range vegetation), strong winds, and an ignition source.

For the Newell Road fire, the ignition was clearly human-related, since there was no lightning during the days leading up to the fire.  Someone did something unfortunate.

Strong winds from the west built rapidly on the day of ignition, winds that were enhanced by COLD AIR moving into western Washington, thus increasing the cross-Cascades pressure difference.

The fire started in the Columbia River windy area.

There is a reason there are wind turbines all around the Newell Road wildfire area.  The NREF wind speed map (annual) shows the Newell Road wildfire area is particularly breezy.

Maximum winds on Friday (shown below) ranged from the mid-20s to 36 mph!   Quite windy.  


Winds came up rapidly that day...and cool air in western Washington was the key.  Again, cool air in western WA is not associated with climate change and flow out the Columbia Gorge from the west DECLINES during heat waves. 

So global warming had nothing to do with it.

Finally, there is the question of bountiful dry fuels that were ready to burn.

We start with the issue that much of eastern Washington, including the area in question, has been taken over by highly flammable invasive grasses, most importantly cheatgrass (a.k.a. grassoline).  

Here is an official government map of cheatgrass presence for non-Federal lands.  Wow...the area of the fire has extensive coverage of cheatgrass.


The influx of this highly flammable and densely growing grass is an important reason why wildfires are more frequent and intense east of the Cascade crest.  Global warming has nothing to do with it.

The grass was particularly bountiful over eastern Washington because last year was WETTER than normal over the region during the grass growth season and thus grass production was well higher than typical.  Spring 2022 was particularly wet and grass growth was substantial.

To illustrate, here is the spring/early summer (April 1-July 21) precipitation by year at Arlington, Or., located just across the Columbia from the fire.  Spring 2022 was the WETTEST year on record...and that contributed to a huge growth surge of grass.


What about drought this year near the fire?

Answer:  As shown by the plot above, THERE WASN'T ANY DROUGHT.  2023 was run-of-the-mill (near average) at this location--and certainly was not unusually dry.

So all the drought talk was without any basis.  

Because of all the precipitation-induced grass growth last year,  the USDA Fuelcast.net website had been advertising all spring the heavy fuel load present and the potential for fire.  


Just to repeat, drought and global warming do not produce bountiful grass loads like this.  USDA officials, such as the extraordinary rangeland expert Matt Reeves, have been warning about the great danger of major fires in the region for a while (you can watch his insightful "Reading the Tea Leaves" videos on the topic if you like.

Matt Reeves warned us

Finally, were the grasses unusually dry due to recent warm, dry conditions?

The answer is certainly no.  Let me prove this to you.

Grasses are known as 1-hr or 10-h fuels because they will dry out within 1-10 hr of drying conditions (no rain, sun). Winds promote rapid drying as well.  So it doesn't matter what happened in the weeks or months before...just a few hours of favorable weather and grass and range vegetation are ready to burn.

Every year, rapid drying occurs during mid-spring east of the Cascades and by mid-June the grasses have dried out and have dropped below the critical fuel moisture percentile (around 10-15%).

Below are the 10-hr fuel moisture values (again suitable for grasses) at the nearby Umatilla NWR RAWS site. Ready to burn (below 10%) by mid-May.  Hardly much drier in late July than early June.


What was the fuel moisture accompanying the excessively wet spring of 2022?  

Consistently ready to burn a little later (end of June).  But even in May that year there were periods of potential fire.

The bottom line in all this is that there is absolutely no reason to suggest drought or climate change had anything to do with the Turner Road fire of the past week, and it is disturbing the major local media (e.g., the Seattle Times) and key public officials are suggesting the opposite.


July 24, 2023

Autumn in Midsummer

 The visible satellite image this morning is stunning:  it looks like something one might see in mid-autumn (see below).

The swirl of clouds associated with a potent low-pressure center is offshore, with a substantial front circling around and then extending offshore of the Washington coast.    That front will reach the western interior around dinnertime, bringing heavier rain.


In the meantime a weak band of clouds/precipitation pushed through this morning, bringing about a third of an inch to the coast and light rain into the interior (see totals so far this morning below).


The radar this morning shows the remnants of the weak first band and a MUCH stronger frontal band offshore.  Quite impressive for late July.


Expect much heavier rain later today, as suggested by the latest UW WRF model accumulated rainfall through 5 AM Tuesday.  Eastern Washington will be rain shadowed by the Cascades.


The next week is going to be relatively cool, as a trough of low pressure will be parked offshore, something indicated by the European Center ensemble forecast of the upper-level heights at 500 hPa (like pressure) verifying Saturday evening.  You will notice the ridge inland, which will be associated with above-normal temperatures over the Great Plains.

The European Center surface temperature forecast for the next five days is for cooler than normal temperatures (blue colors) over the Northwest and BC, but toasty over New Mexico, Texas, and the high Plains--a reversal of the pattern experienced earlier this summer.


I should have known it would rain after I decided to paint my fence on Sunday...


July 23, 2023

Rain and Cool Temperatures During the Driest Portion of the Year

Northwest weather, particularly over the western side of the region is about to change profoundly.

For the last month, much of the region has been warmer and drier than normal, in contrast to much of California, Nevada, and the Plains States that have been cooler and wetter than typical (see temperature differences from normal for the past 30 days, below)


But now the models are in agreement:  an unusually strong Pacific front will move through late Monday, bringing wetting rain to the region and much cooler temperatures.  

Furthermore, the extended forecasts indicate moderate, typical temperatures for the following week, with no regional heatwaves for the remainder of July.

Take a look at the total precipitation predicted through 5 AM on Tuesday.  Several tens of an inch over much of western Washington.  Southwest BC will be even wetter.


To get an idea of the timing and the uncertainties in the forecast, below is the predicted precipitation accumulation at Seattle from the UW ensemble system of many high-resolution forecasts. Time increases to the right and the average of all the forecasts (usually a good prediction) is the black line.  Time is in UTC (00/25 is 5 PM Monday)

Quite a bit of uncertainly in amount, but you can bet on several tenths of an inch in Seattle.  Precipitation should mainly fall Monday night as the front moves through.


Temperatures will not get out of the 60s on Monday, before moderating to the 70s:


And there will be substantial heat relief for our friends in eastern Washington, with temperatures dropping generally into the low 90s.


This cool bounty is associated with an unusually strong low-pressure system and a cold front that will move in on Monday.  Below is the forecast sea-level pressure map for Monday at 11 AM (low-level temperatures are also shown by color shading, and I indicated the frontal location with the red line).

Wow...a 1004 low with some strong winds behind it, and the front is still offshore at this time.  


As indicated by the standardized anomaly chart at the same time, this low is highly unusual for this time of the year (the light purple color indicates an anomaly from normal more than four standard deviations for the mean).


The latest (Sunday morning) visible satellite image shows an impressive offshore front for this time of the year:


Importantly, the highly skillful European Center ensemble of many forecasts suggests that the upper-level trough of low pressure associated with this surface low will remain in place for the next week (see forecast below, blue indicates lower-than-normal pressures aloft)


This pattern should lessen the wildfire threat over the region, although grass fires east of the Cascade crest can still occur and can be aided by the strong westerly winds encouraged by westside cooling.

Finally, let me end by noting that the rain tomorrow will be ironically occurring during one of the climatologically driest days of the year over western Washington (see below)

It is all downhill from here.😆


July 20, 2023

Is Global Warming Causing Massive Heatwaves?

The media is going hyperbolic about heat waves, claiming that global warming/climate change caused by human CO2 emissions is producing a huge, sudden uptick in massive heat events.   The greatest in the historical record.  Heatwaves are all over the planet! Phoenix, Arizona is a frequently noted poster child of the new heatwave regime.

Here are a few examples of the headlines, I could provide dozens more just like it.


The Quiz

    Before I discuss the situation, let me provide two possibilities for you to consider.

(1)  Human emissions of greenhouse gases, such as CO2,  are slowly warming the planet.  During the past century the Earth has warmed by roughly 1°C and human emissions could have contributed much (but not all) to the warming.   El Nino periods contribute to temporary warming, and local warming due to urbanization (urban heat island) is also important.  Most heatwaves are predominantly natural phenomena, with minor enhancement from global warming/climate.

(2)   Heatwaves are predominantly forced by increasing greenhouse gases.  The entire planet is experiencing unparalleled heat due to human-caused climate change.  By reducing greenhouse gas emissions, heat waves could be greatly weakened or prevented.

Which do you think is the correct answer?   The one supported by observations and peer-reviewed science?

The correct answer is  (1).  Heatwaves are mainly caused by natural variability, with humans enhancing them a small amount.  Let me prove it to you and describe some of the hype and deception going on in the media and by others.

It is important to understand that current heatwaves are localized, with substantial portions of the planet experiencing cooler-than-normal conditions as well.  Most of the planet is NOT experiencing unusual warmth.

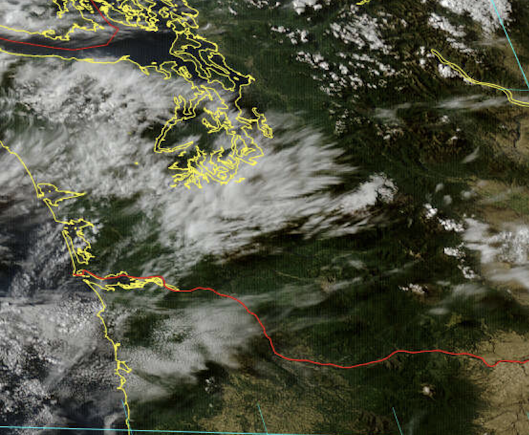
Consider the observed temperature pattern on Tuesday night at 11 PM, or more exactly the difference in the observed temperature from normal (see below).  Red areas are above normal and blue/green are below normal.

The figures shows that the Earth has BOTH heatwaves and cold waves going on at that time.  

For example, the Southwest US. is warm, while much of the eastern U.S. is colder than normal. Northern Europe is cold, while southern Italy is experiencing heat.


So heatwaves are localized (and transient) conditions and only a small portion of the globe is experiencing unusual warmth.  Greenhouse warming from greenhouse gases is much more uniform.

So what is causing the localized warming?   The answer is very evident if we plot the upper-level map (for 500 hPa, about 18,000 ft) at the same time (see below).  Blue areas indicate troughing (low pressure) and red areas indicate ridging (high pressure). 

The warm areas are closely associated with ridging aloft and cool areas with upper-level troughing.  Ridging is associated with sinking air and warming.   The opposite with troughing.  Ridges and troughs also have wind patterns that can move tropical warmyh poleward (and vice versa).


Such wave patterns are quite natural.   There is no convincing evidence that the atmosphere becomes wavier (thus with more heatwaves and cold waves) under global warming.  I have read all the literature on this and have published on the topic myself in the peer-reviewed literature.

The waviness of the upper-level flow was particularly high-amplitude this winter and spring, producing enhanced cooling in some areas and warming in others.  Such as the cool/wet conditions in California, and warmth in southern Canada.

Let me repeat:  there is no reason to think this waviness is other than the expression of the natural variability of the atmosphere.

With the general temperature of the planet slowly rising from human greenhouse gas emissions (by roughly 1°C), the heatwaves should be about 1C warmer and cold waves about 1C weaker.  

This is exactly what is observed.

By the way, extreme cold kills FAR more people each year than heatwaves, so global warming is actually reducing deaths from extreme temperatures (you won't hear much about this in the media!)

But there is something else that is enhancing warming right now.   

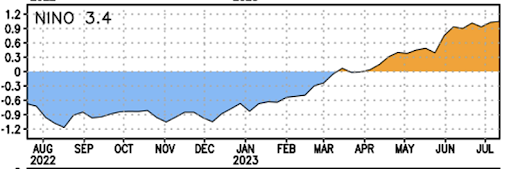
This spring El Nino rapidly turned on, and El Ninos warm the planet!  Below is the key marker of El Nino:  the temperature in the central tropical Pacific (the Nino 3.4 area).  A VERY rapid and early warming during April and May.


The oscillation between El Nino and La Nina (cold water), is a natural model of atmospheric variability.

Would we have had major heatwaves without human-caused global warming?  

You bet we would.  We certainly had substantial heatwaves (some as strong or stronger than this month) in the past (such as in the 1930s).  Were the heatwaves this week enhanced modestly (like 1°C) by global warming.   Quite possibly.  So a place like Phoenix would have had a high temperature of 115F instead of 117F.   Pretty much the same impacts.

Media Deception Regarding Phoenix, Arizona

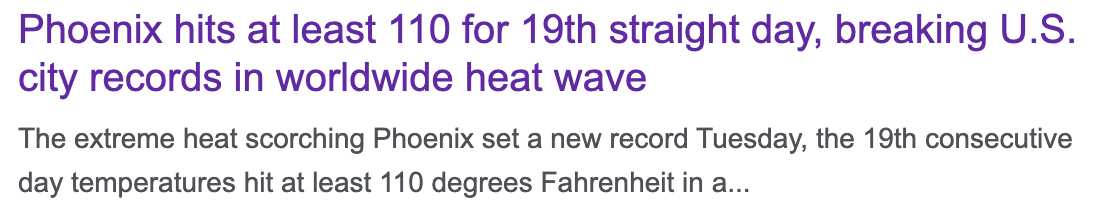
The media has been particularly interested in the recent warm spell in Phoenix, in which they are headlining its record for the number of days above 110F.


As I will describe below, there is more than a little deception going on here.   The 110-degree approach is a prime example of misinformation, and the Phoenix temperature record is highly suspect because of massive development and a huge urban heat island effect.

"Cherry Picking"  Statistics

The term cherry picking can be defined (Wikipedia) as:

Cherry pickingsuppressing evidence, or the fallacy of incomplete evidence, is the act of pointing to individual cases or data that seem to confirm a particular position while ignoring a significant portion of related and similar cases or data that may contradict that position.

The media and some climate activist groups have been advertising that Phoenix has now exceeded 110F a record number of times in a row.  Thus, something unusual and scary is occurring.

But why 110F?  Did you wonder about that?    

They did this deliberately because if they had picked another temperature they would have gotten a completely different answer, one in which Phoenix was not unusually warm.


Consider a choice of two-degree difference (112F).   This year drops to 6th place!


How about something more unusual (115F)?  2023 drops to 8th place


Or let's consider more "garden variety" heat (105F).   This year remains in 8th place.


Do you feel deceived and tricked?  This was a deliberate attempt to cherry-pick statistics to push an agenda.  Not good.

But the selection of Phoenix is worse than that.

Phoenix has perhaps the most profound and rapidly growing urban heat island in the nation.

Phoenix has been one of the most rapidly growing cities in the US (see below) and all the construction (concrete, buildings, sources of heat) results in profound warming, something known as the urban heat island effect


Do you want to see Phoenix's heat island in action this week?  

Below are the temperatures on Tuesday during the late afternoon.   117F at the Phoenix airport but 111F just outside of the metro area.  This difference is quite typical for the city.


So even if there was no global warming going on, Phoenix's temperature would have substantially increased over time due to the rapid development of the city.  Such urban heat island effects seriously degrade the temperature records, producing artificial warming.

Want another example?  SeaTac Airport, whose third runway and local development have impacted (warmed) the temperature record there.

Finally, let me note that although the Earth is slowly warming from human-induced greenhouse warming, there is no evidence that heat waves are being amplified or enhanced over this base warming.   So all the panicky headlines are really without merit.  

Want to see an example of this?   Below are the annual high temperatures at Olympia, Washington, with a linear trend line added for your benefit.  Annual high temperatures have gone up about 2F, roughly the same as the global warming signal.


Claiming that a sudden and rapid increase in heat waves is occurring due to global warming may be good clickbait for the media and a potent tool for climate activists, but it is simply not true.

Finally, let me note that headlines early this month that the Earth was warmer than any period during the past 125,000 years were really nonsense.  But I will leave that discussion to another blog.


El Nino is Rapidly Collapsing

 It's finally happening.    The pesky El Nino, with warmer than normal surface waters across the central and eastern tropic Pacific, is ...