July 31, 2014

Greatly Increased Threat of Lightning and More Wildfires

There are several major fires burning in eastern Washington, including the huge Carlton Complex fire north of Wenatchee and Chiwaukum fire near Route 2.  Both were visible from Seattle this afternoon.
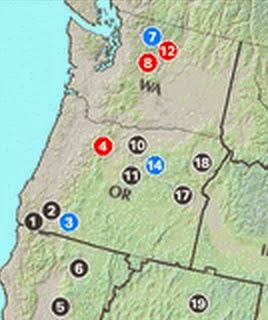
Eastern Oregon, which has been hit by a lot more lighting than eastern WA has far more fires (more than 2 dozen) going at this time.  The U.S. Forest Service Major Incidents map tells the story (see graphic below)


But the situation is getting worse as temperatures rise and relative humidities drop east of the Cascade crest.  And to top it off, the amount of convection and lighting are about to substantially increase.

Let's begin by looking at the relative humidities at Wenatchee, on the eastern slopes of the Cascades.

You will notice they are progressing downward, with the minimum today dropping under 10%.  Relative humidity changes during the day, being the lowest when the temperatures are warmest.  The temperatures at Wenatchee have been over 100F for four days.

 Warm temperatures and low humidities are further drying the surface and vegetation--the "fuel" of future fires.  The Forest Service 10-h fuel moisture shows how dry things are in eastern Washington and Oregon today. The dark red/brown ins the worst...right over eastern WA.


So the surface is ready to burn and the potential for new fires has increased the past few days due to the drying conditions.  And, of course, there are several dozen fires already burning east of the Cascade crest.

But now we have another problem:  the amount of thunderstorm and lightning activity is about to increase big-time over Washington.

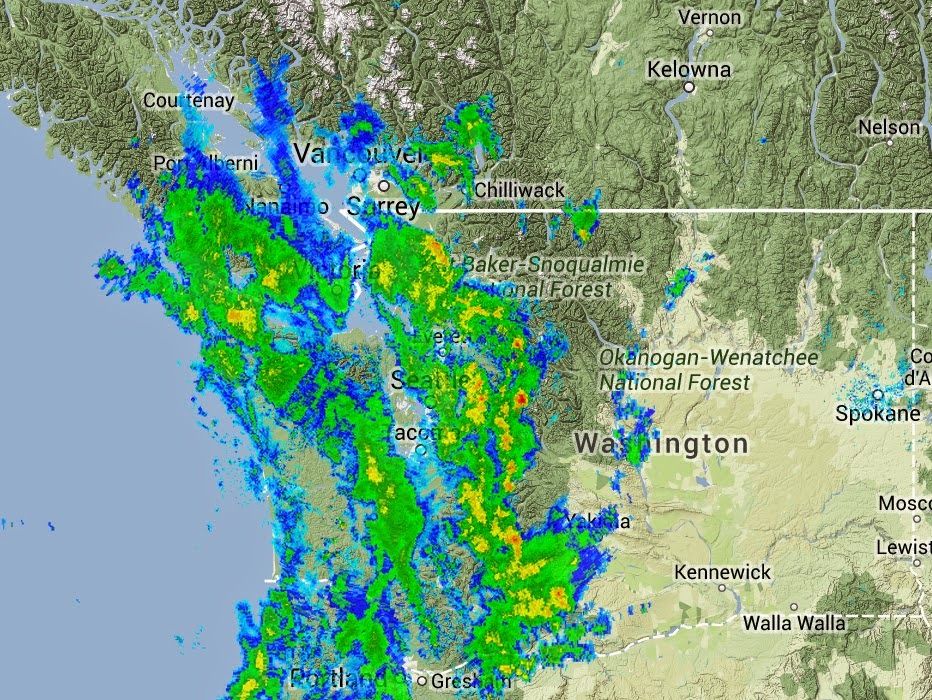
The signs were starting to be evident today as some thunderstorm were initiated on the southern Oregon Cascades and drifted eastward.  The radar image at 5:30 PM showed several of them:


And here is the 1-h lightning strikes starting at 5:30 PM


Unfortunately, the models indicate that the thunderstorms will become far more prevalent over the next few days.  Let me shown you some examples from the UW WRF system.  The following figures shows the 24-h rainfall ending 5 AM on Saturday and Sunday.

For the 24 ending Saturday morning  (most of the showers would be Friday afternoon and evening), there are lots of showers over the central and north Cascades, and some in northern Oregon.


The next 24h indicates a major uptick in showers (including thunderstorms), particularly in the north Cascades and Okanagon.


The enhanced showers are associated with a combination of increasingly unstable air and the upward motion associated with a weak trough moving into the region, as illustrated by an upper level (500 hPa) chart at 11 AM Saturday.

So we have the fuel (dry trees, bushes, grasses) and the ignitor (lightning).  There is a good chance of more fire starts, particularly over Washington.   And the large upper ridge is staying in place...so the fire risk is not going away soon.  Our regional wildland firefighters, already tired from restraining the last round of major fires, may be faced with an even more onerous task.  You really have to respect what they do.


July 28, 2014

Will the Pacific Northwest be a Climate Refuge Under Global Warming?

As global warming takes hold later in the century, where will be the best place in the lower 48 states to escape its worst effects?

A compelling case can be made that the Pacific Northwest will be one of the best places to live as the earth warms.   A potential climate refuge.

Let's analyze this important question.

I will start with a clean map and highlight problematic areas as the climate warms.


Sea Level Rise

Low-lying coastal areas will be vulnerable as sea-level rises 1-2 feet during the next 85 years.  Based on USGS (U.S. Geological Survey) publications (for example, the USGS threat maps below), I have indicated problematic locations in red.  Forget Florida.


Red areas indicates regions that will experience substantial negative impacts of global warming from sea level rise

Water Availability

 Climate models are emphatic that the SW U.S. will get less precipitation and evaporation will increase as the temperature increases.  This will substantially reduce water availability for agricultural and other uses (see figure for the situation in 2050 that is in the recent U.S. National Climate Assessment). Texas, Oklahoma, Kansas, eastern Colorado, Nebraska and Florida are also heavily impacted.

Based on this document and others, I have marked up the U.S. map with yellow to indicate areas that will be highly stressed for water.


Hurricanes and Tropical Storms

Although the latest research does not suggest that the number of hurricanes will increase, much of the literature is emphatic the the most intensive hurricanes will get considerably worse.  The regions influenced by hurricanes should not change much, as illustrated by the150-year hurricane track climatology (see graphic).  The SE U.S. and the East Coast are most threatened, and I note that more severe hurricanes can cause both  increased storm surge damage along the coast and heavy


precipitation/flooding in in the interior.  I have marked (in orange) additional locations that might be significantly affected by hurricanes.


Heat Waves

Heat wave can be big killers, particularly for the elderly.  Here is the temperature change maps from the latest U.S. Climate Assessment


The interior of the continent really heats up, with the West Coast moderated by the cool Pacific Ocean.  So, in the U.S. map I have put purple dots for the blank locations with substantial heat wave risk.


Other Issues

With warming temperatures, the atmosphere will hold more water vapor, potentially leading to more precipitation.  The IPCC (Intergovernmental Panel  on Climate Change) notes considerable uncertainty on the distribution of resulting flooding, but the U.S. National Assessment notes that the biggest increases during the contemporary period has been in the Midwest (see graphic).


My own research has suggested that atmospheric rivers could be enhanced under global warming, which might result in increased flooding, but only near major rivers draining western U.S. mountains. To denote that risk I will put a few green dots on the map.  No issue for Seattle assuming the Howard Hansen dam is properly maintained.


There are many other, more minor, issues that I won't deal with here.  According to the U.S. National Climate Assessment, ticks capable of  transmitting Lyme's disease could become far more prevalent in the Midwest under global warming (see graphic)


---------------------------------------------------------

So what conclusion does one inevitably reach by studying the IPCC reports, the U.S. Climate Assessment, and the climate literature?

The Northwest is the place to be during global warming.   
  • Temperatures will rise more slowly than most of the nation due to the Pacific Ocean (see below)  
  • We will have plenty of precipitation, although the amount falling as snow will decline (will fall as rain instead).  But we can deal with that by building more reservoir and dam capacity (and some folks on the eastern slopes of the Cascades have proposed to do exactly that).
  • The Pacific Ocean will keep heat waves in check and we don't get hurricanes.
  • Sea level rise is less of a problem for us due to our substantial terrain and the general elevation rise of our shorelines.  Furthermore, some of our land is actually RISING relatively to the sea level because we are still recovering from the last ice age (the heavy ice sheets pushed the land down and now it is still rebounding).
  • There is no indication that our major storms...cyclone-based winds (like the Columbus Day Storm)... will increase under global warming.  
  • Increased precipitation may produce more flooding, but that will be limited to river valleys and can be planned for with better river management and zoning.
Temperature of the eastern Pacific, which controls Northwest weather, have been COOLING the last 35 years (blue color)

Several media outlets have noted that the Northwest and its principal city, Seattle, should be particularly good places to ride out a warming planet.  Here is an example:


Portland State University has also done a study suggesting that the Willamette Valley will be a magnet for the global warming migrants:

Yes, the Northwest may well become a climate refuge during the upcoming century.  
The big question?  


How do we keep the Californians out?   One idea is shown below.


July 27, 2014

No Precipitation over the Next 8 days

Here in the Northwest, we are now going into the  climatologically driest period of the year, with July 29 being the most arid day on average.

One of my favorite plots is the forecast precipitation over the next 8 days, in this case from the National Weather Services's GFS model.  Take a look at it.

 Completely dry over Washington, making us probably the driest state in the union.

 The desert southwest, particularly Arizona, N. Mexico,  and Colorado are quite wet as the SW Monsoon is at its height.   Alaska is wet, with rain spreading south into central BC.   The thunderstorm-ridden eastern half of the U.S. is quite moist, with particularly heavy precipitation along the coast. Some thunderstorm in eastern Oregon and perhaps a few of them might slip into eastern Washington.


The NOAA/NWS Climate Prediction Center's 6-10 day temp forecast is for much warmer than normal temperatures over the West Coast, but much cooler than normal over much of the eastern half of the U.S.


The origin of this persistent pattern?   A major ridge of high pressure over the Rockies and troughs over the eastern U.S. and the gulf of Alaska.    Here is the upper level map (500 hPa, about 18,000 ft) for Thursday night (120 hr forecast).


So wonderful weather for recreation and Seafair during the next week. Perhaps for hiking, boating, and whatever you like.

But we are setting ourselves up for a another wildfire outbreak as the surface dries out.

 Eventually, this pattern will break down and with it will come thunderstorms and strong winds pushing across the Cascades.

July 25, 2014

Showers of Toads

The old folks always like to talk about how the weather was so much more extreme in their youth.  Well, maybe they are right.

Here is a copy of the weather record of July 1887 for Klamath Falls, Oregon.  What a month.

Temperatures getting into the 90s on several days.  
Forest fires the first half of the month.
Thunderstorms on the 6th.
And SHOWERS OF TOADS the same day.

Yes, showers of toads.  Remember this report has been certified by the U.S. Government


It turns out that showers of toads may be rare, but not unheard of, as documented by an article in the Guardian.

Here is the explanation they offer:

The young toads, or frogs, on leaving the water do not always find conditions suitable for travelling; in hot and dry weather they cannot find food and are apt to be slain by their skins getting parched. All batrachians, however, can subsist for a long time without food, and grow little during this fast; they seek shelter under damp wood, stones, or other cover; they practically aestivate, a summer slumber similar to hibernation. The sudden deluge gives them the opportunity for which they are waiting; they emerge from their shelters and set off on their travels in search of new homes. It was one of these happy bands of pilgrims, travelling in all directions, that my correspondent saw.

Could the thunderstorm in Klamath Falls have unleashed the toads?


And there are many other reports of toads falling out of the sky:

October 1683 - In Blinkling Hall, toads poured down on the Nortfolk Village of Acle.

August 1804 - It had been a bright, clear day and then suddenly a great cloud appeared. Out of it, as people watched, fell the numerous little toads.

June 1892 - A fall of little frogs near Birmingham, they were not like the local ones but were described as almost white.

September 1922 - At Chalon-sur-Saone, little toads fell for 2 days.

June 1954 - Sutton Park, Birmingham. People witnessed hundreds of little frogs bouncing off umbrellas.

January 1973 - A shower of tiny frogs about the size of nickels fell from the sky during a thunderstorm.

September 1973 - Tens of thousands of small toads fell from the sky in a freak storm onto the southern French village of Brignoles.

In fact, reports of precipitating frogs can be traced back to classical times. The Greek author Athenaeus, quoting the historian Heraclides Lembus, wrote of such an account: "In Paconia and Dardania it has, they say, before now rained frogs… So great has been the number of these frogs that the houses and the roads have been full of them."

There have been other suggestions of toads being sucked up by tornadoes and scattered around the countryside.  You heard of Sharknado.   Can you imagine Frognado?   For some reason, I like flying frogs better than flying sharks...much safer.


And by the way, the latest chapter of the Sharknado saga airs this week.  

(thanks to Mark Albright for sending me the Klamath Fall July 1887 record)

July 24, 2014

Yesterday's Impressive Rainfall Totals

There were some amazing rainfall totals on Wednesday, with particularly heavy amounts (2-3 inches) hitting the foothills of the Cascades.  Here are the 24h totals ending around 9:45 PM Wednesday.  You will notice a big east-west gradient across the Sound, ranging from a few tenths over the Kitsap peninsula to inches over the eastside.  Port Angeles and Victotia had almost nothing.


Precipitation actually decreased as you went up into the mountains.  A lot of precipitation occurred as unstable air was forced upwards on the western side of the Cascades.

Seattle Rainwatch, based on only the Camano Is. radar,  also showed some of these features, including the particularly heavy rain southeast of Seattle, and rainshadowing north of the Olympics.

A number of daily records were broken yesterday.  Here is a sampler from the National Weather Service:

RECORD EVENT REPORT
NATIONAL WEATHER SERVICE SEATTLE WA
127 AM PDT THU JUL 24 2014

...RECORD DAILY MAXIMUM RAINFALL ACROSS WESTERN WASHINGTON...

A RECORD RAINFALL OF 0.76 INCHES WAS SET AT SEATTLE-TACOMA WA
AIRPORT YESTERDAY. THIS BREAKS THE OLD RECORD OF 0.54 SET IN 1949.

A RECORD RAINFALL OF 0.89 INCHES WAS SET AT SEATTLE WA WFO
YESTERDAY. THIS BREAKS THE OLD RECORD OF 0.07 SET IN 2007.

A RECORD RAINFALL OF 0.27 INCHES WAS SET AT OLYMPIA WA AIRPORT
YESTERDAY. THIS BREAKS THE OLD RECORD OF 0.25 SET IN 1949.

A RECORD RAINFALL OF 0.72 INCHES WAS SET AT BELLINGHAM WA AIRPORT
YESTERDAY. THIS BREAKS THE OLD RECORD OF 0.22 SET IN 1949.

A RECORD RAINFALL OF 0.63 INCHES WAS SET AT HOQUIAM WA AIRPORT
YESTERDAY. THIS BREAKS THE OLD RECORD OF 0.04 SET IN 1995.

The "bar" is low for breaking precipitation records this time of the year, but still we had a lot of rain.

This morning we are getting some "backwash" on the western side of the low, but this precipitation is lighter and should fade out this afternoon.  The worst is over.

July 22, 2014

Amazingly Wet July Day on Wednesday

8 AM update

Lots of heavy showers and thunderstorms moving through  here is the latest radar.  Yellow are heavy showers....and there are even some reds (downpours or hail) in a few cells.


and the lightning during the half-hour ending 7 AM in shown below.  Not much lighting in easternWA yet. Lots on the eastern side of Puget Sound.


*We are now entering the climatologically driest period of the year, with the last week of July/first week of August being the most arid of the year.  July is usually our driest month, and this year has been drier than most (only a trace of rain so far at Sea-Tac airport).

But everything changes tomorrow, when a July deluge is forecast by our weather forecasting models.

Just to impress you.  Here is the 48h total precipitation predictions to occur starting 5 PM Tuesday and ending 5 PM Thursday.  Wow.  The western slopes and crest of the Cascades get hammered, with totals of 1-3 inches.  Even the western lowlands get quite wet, with modest amounts extending into eastern Washington.  Not a good time for hiking or camping in the Cascades.


This heavy rain is associated with the approach of a sharp upper-level trough/low (see upper-level map for 5 PM on Wednesday.)  Pretty impressive this time of the year.


This air is potentially unstable and there could well be some embedded thunderstorms.

The rain should start moving in around 8 AM

 Strengthen and move northward during the day
Transition to showers as the low passes by on Wed. night


And then we get more rain on the backside of the low on Thursday AM
I am worried about eastern Washington getting light rain, including some thunderstorms--with the potential for more lightning induced fires.  And there is the potential for strong winds over both western and eastern Washington as the trough/low move through.

I expect several local stations to exceed their daily records if the models are right.


July 21, 2014

Melt-Out Day in Paradise

Yesterday, July 20th, was a big day at Mount Rainier National Park;   melt-out day at the Paradise Ranger Station at 5500 ft.  This reporting site is particularly important and valuable because there is a 98 year record of snow measurements (1917-2014).

It may have been foggy at Paradise, but snow to be seen!

There is, of course, importance in this date because of concerns about global warming. With warming temperatures you would expect less snow and an earlier melt-out date.  A number of media stories have talked about global warming causing mountain snows to melt out early.  So at a long-observed location, what is actually happening?

For the entire 98-year record, the average snow melt-out date is July11th at Paradise.  So the snow stuck around for NINE DAYS more than the long-term average.

Mark Albright, a research meteorologist at the UW, has produced a nice table summarizing melt-out date by decade. The earliest melt-out dates were in the 1930s and 1940s, followed by the 1960s,


What about a nearby station to the south, Mt. Hood, at 5400 ft?   The snow melt date there was July 2nd, which makes sense since Hood is over 100 miles to the south of Rainier.  Mark Nelson, chief meteorologist at channel-12 in Portland, did an analysis of the snow-melt dates at Mt. Hood (found here).   Take a look at the graph that he produced.  The melt out was within a day of the average for the last 33 years (July3).  And it does look like the melt-out date is generally getting later at Mount Hood.


The bottom line of all this analysis (and much more that I am not showing you), is that the snow at mid to upper elevations in the Cascades is not melting out earlier during the past few decades.   As I noted many times in this blog, the Northwest is a favored location when it comes to global warming, with the eastern Pacific showing little warming during the past few decades.   The eastern Pacific determines the nature of the air masses approaching our mountains and thus we can't expect an earlier melt of the snowpack.

Eventually, the eastern Pacific will warm, but its slow change will buy us (and our snow pack) time here in the Northwest.

Global Warming, the Media, and Coal Trains

I will be giving a talk in Friday Harbor and Eastsound, sponsored by the San Juan Island and Orcas Is. libraries.

I will be discussing the serious threat of global warming, how the media is generally doing a poor job in educating about this issue, and how mankind is really not taking it seriously (e.g., the coal trains). 

Friday Harbor: July 22nd, 6:30 PM, The Mullis Community Center, 589 Nash St.

Orcas Island:  July 23rd, 5:30 PM, Orcas Center

July 19, 2014

Gusting Winds Result In Explosive Fire Growth

During the past few days, several small fires--most initiated by lightning--exploded as winds have surged due to the cooling and increasing pressure west of the Cascades.

In only a few days, one fire has gone from virtually nothing to over 200,000 acres--the Carlton Complex Fire northwest of Lake Chelan.  And the fire near Leavenworth also grew rapidly as winds increased.

To illustrate the wind speed increase, here are the sustained winds (not gusts) at Ellensburg and Wenatchee over the past two weeks.  The last day has been the windiest in a while.


 The max wind during the 24h period ending 9 PM on Frida, shows gust reaching 40-50 mph (ignore the 159 numbers) along the eastern Cascade slopes.


As I noted earlier, the cooling west of the Cascades causes the pressure differences across the mountains to rise (cooler air is more dense and thus weights more), and that contributes to the stronger westerly winds.  Take a look at the forecast pressure map for 11 AM this morning (solid lines are lines of constant pressure, isobars).  You can see the intense pressure gradient across the Washington Cascades.


The good news is that cooler air is moving across the Cascades and the pressure difference is now dropping, which should allow the winds to relax a bit over the weekend.

Global Warming, the Media, and Coal Trains

I will be giving a talk in Friday Harbor and Eastsound, sponsored by the San Juan Island and Orcas Is. libraries.

I will be discussing the serious threat of global warming, how the media is generally doing a poor job in educating about this issue, and how mankind is really not taking it seriously (e.g., the coal trains). 

Friday Harbor: July 22nd, 6:30 PM, The Mullis Community Center, 589 Nash St.

Orcas Island:  July 23rd, 5:30 PM, Orcas Center

Should I Let AI Write My Blogs?

I spend a lot of time thinking about and writing my blogs.   Could AI apps do the work for me?   Could any of you tell the difference? Well,...