December 31, 2011

Finding Sun

During this time of the year there are few more important questions for sun-starved Northwesteners.  How can one get to sun, either in the car, or in the shortest plane ride possible?  This blog will provide some guidance.

We start with the problem.  The western side of the state is one of the cloudiest places in the country during the winter and the "bowl" of eastern Washington often fills with low clouds.  Plus, we are fairly far north and thus days are short.  Fortunately, a little bit of meteorological knowledge and online access to satellite imagery can help you get to sun on many days with a modest drive even when your home is in the murk.   And sun is nearly always a short (and inexpensive) plane ride away.

Step 1:  Find a good online satellite imagery source

     To find sunshine, you need to view satellite imagery--and particularly visible satellite animations.  There are a number of good sources of such information, but one I recommend is provided by the National Weather Service: http://www.wrh.noaa.gov/satellite/?wfo=sew
There are many others, including my own department web site.  If we are in an unusually sunny situation you will be able to determine that from such imagery.  If sunny, don't proceed any farther and GET OUTSIDE ASAP TO ENJOY IT!

Step 2:  There are clouds in your area and you want to see if there is
some nearby sun.  No problem. 

If there is strong southwesterly flow, then check for a cloud-free zone to the northeast of the Olympics, roughly between Port Angeles to Port Townsend, and yes Sequim.  Sometimes the clearing stretches to Victoria and the southern San Juans.  An example is shown below.  You see this...you know where to go!  In fact, there is an entire web site dedicated to this cloud free zone (http://www.olympicrainshadow.com/)


But there are plenty of times the entire western side of the Cascades is full of clouds.  What do you do?

If the flow is more westerly, then there might be a convergence zone over central Puget Sound.  It is pouring and raining over Seattle--depressing!  But the convergence zone is narrow...a short car drive north and south will get you into sun?  Don't believe me?  Check out the satellite picture from yesterday.  And with westerly flow there is often sinking flow and clearing skies over the eastern slopes of the Cascades--Cle Elum, Wenatchee, Ellensburg, or Yakima could be in bright sun even if the rest of eastern Washington is in the murk (see same image). 


Or during periods when high pressure is overhead and flow is weak, the lowlands of western and eastern Washington are in low clouds, but the mountains are clear (see below).  What do you do?  Head up!  Go for a hike or do some skiing.  Or just drive up there with some suntan lotion.  Here is an example.


Step 3:  The Northwest is completely cloud covered from a major storm.  And you want warm temperatures and sunny skies.  Where do you go if you can't afford to fly to Hawaii or Cancun?  No problem.  Head to the desert southwest of the U.S.  Take a look at the number of hours of sun in December in the graphics below (red is most, dark grey is least).  The U.S. southwest is amazingly sunny mid-winter.  The worst place (us) and best place (SW) are only about 1000 miles apart!  Palm Springs, Tucson, etc. are very safe bets for mid-winter sun...and you can find relatively inexpensive fares (order of $200 RT). 


So the bottom line: using a little meteorological knowledge can go a long away to avoiding Northwest winter blues from lack of sunshine.


December 28, 2011

Subtropical Moisture, Record Lost, and Thank You

First, the thank you.   I very much appreciate the contributions of over one hundred of you to my weather research fund.   It has allowed me to fill in the financial holes for running the local weather prediction modeling research, helping to make up for losses as funding agencies reduce support.  Furthermore, I am dedicating $2000 of the support for an undergraduate Weather Research scholarship.  As an instructor and the department's undergraduate adviser, I see first hand the impact of the rapidly rising UW tuition, with many of our undergraduates acquiring large debt levels and working more and more hours--leaving less time for study and sleep.  The most extreme case of this was one student that kept on falling asleep in my junior synoptics class.  I talked to him one day about it...turns out he was supporting himself by fueling jets at Sea-Tac airport overnight!  Anyway, as long as the contributions come in I would like to continue using a portion of the funds for scholarships.  And thank you to all of you that have sent me tips and suggestions about my lost dog Leah.   She is still roaming around Mountlake Terrace and it is maddening that we have not found her yet.

Today, it was warm, moist and balmy---the warmest and wettest day in over a month.  Many locations in western Washington reached the mid-50s, as subtropical, southwesterly flow surged into the region.  As apparent from this satellite-based vertically integrated water vapor content image, the moisture plume did not come from near Hawaii, but pushed westward and northward across the north-central Pacific (purple and red, highest values, followed by orange and yellow).  This is a modest atmospheric river with origins in the subtropics.


The plume most directly intersected the coast south of Washington on the northern Oregon coast, and thus the higher precipitation amounts were to our south.  Here is the 24-h precipitation totals ending 9 PM on Wednesday.  Values ranged from a trace (.01 inch) in the middle of the rainshadow NE of the Olympics to 3-5 inches on the western slopes of the Olympics, coastal mountains and Cascades, with particularly large amounts over NW Oregon.  Talking about rainshadows, amazing low values in eastern Washington (trace to a few hundredths of an inch).


And as long as we are talking rainshadows...here is a radar sample during the early afternoon, when the shadow was centered near Everett.  You got to love living around here---you can be completely dry at one location, but pouring a short car drive away.

A weak disturbance comes in later tomorrow (Thursday), a stronger system on Friday, and believe it or not, a relatively dry New Year's weekend is ahead.  A very normal situation.

Finally, the rainfall today has prevented Seattle from enjoying the driest December on record---we did have the driest first three weeks on record, though.   But the drought and the west coast ridging that produced a mainly dry December has resulted in the western U.S. snowpack being well below normal. Here is the latest snow water equivalent chart, giving the % of normal. Washington is now mostly 70-100% of normal, Oregon about 50% of normal, and the CA Sierras down under 20%.  Want above-normal snow?   Head to Arizona and New Mexico!

December 26, 2011

The Christmas Day Storm

Yesterday brought quite a blow to portions of westerns Washington, with gusts reaching 50-65 mph, loss of power to tens of thousands of people, and the tragic death of a young girl.  It is also an event that was underplayed by the National Weather Service, although they did have a Gale Warning out for the coast and NW waters.  This is an example of powerful winds associated with a very strong frontal passage, rather than an intense low moving to our north.  There is a lot to discuss.


So how strong did the winds get?  Here is a list of a few locations.  One unofficial spotter at Three Tree Point near the Sound reported a 63 mph gust.  For many locations, the winds yesterday were the strongest over the past year.

Spd(mph) Time(PST) Location
----------------------------
60 ~11:30 Alki Point Light
56 11:32 Bellingham Airport
54 11:31 Whidbey Island NAS
58 9:21 Smith Island
56 11:46 Paine Field
54 11:45 Edmonds Marina
58 11:22 West Point Light
53 11:50 Evergreen Pt Bridge
41 11:28 Boeing Field
53 11:16 SeaTac Airport
43 11:50 Renton Airport

and..as noted in a comment below, 122 mph at Camp Muir on Mt. Rainier!

Here is a plot of the hourly winds at Seattle's West Point.  You will see how quickly the winds rose, peaked, and dropped and the very intense pressure trough (large pressure drop before the highest wind, followed by an intense pressure rise).  Green is pressure, blue sustained winds and red are gusts.


Imagine taking a ferry ride across the Sound?  Here are the winds from the Edmonds/Kingston ferry.  SUSTAINED winds of up to 47 knots (54 mph)!  The would been an exciting trip.


This wind event was associated with a strong front, one that was unimpressive in terms of precipitation, but one with a very strong pressure trough and wind shift.  It is also an event that new coastal radar provided a lot of hints of possible strong winds.

Here is a forecast from the UW WRF model (initialized at 4 PM on Saturday) for 7 AM on Sunday.  Very sharp front.  Large north-south pressure difference and strong southerly winds in front of it.  Very sharp wind shift to westerlies behind it.


 Let me show you the forecasts from the high-resolution (1.3 km) WRF model at 10 and 12 PM showing predicted gusts (knots).  Much stronger winds over and near the water, with some gusts reaching 40-50 kts.  Not perfect, but certainly suggests a strong event.


But what about our new coastal radar near Hoquiam?  Did that tell us anything as the front approached?  I rarely show you the Doppler velocities from the radars, but I will now.  The color indicate the speed of the air towards or away from the radar.  Here are the winds at 9:12 AM.  The sharp color contrast indicate very powerful southeasterly flow on the cooast and a very strong frontal wind shift immediately offshore.  This was a powerful front.


In addition, coast observations, such as at Destruction Island, indicated an unusually intense frontal passage, as shown below.


Anyway, a good example of what a strong frontal passage can do and the strengths and limits of our technology.  An example of why we need more effective nowcasting--short-term diagnosis and forecasting. And one more thing...there is a lot of action predicted for this week...so keep tuned.

December 23, 2011

The Big Shift in Our Weather

Mother nature has a holiday gift for you--a major shift in  our weather pattern.  For roughly three weeks, the Northwest has been preternaturally dry, you would think we were living in Palm Springs!  For example, Seattle-Tacoma airport has only received .25 inches this month, 3.61 inches below normal.  Yesterday, sun was nearly everywhere and seasonal affective disorder (SAD) cases are surely down this winter.

It all ends this weekend.

Instead of the high-amplitude, persistent ridge in the eastern Pacific the atmosphere will transition to what meteorologists call zonal flow, in which the jet stream, and the strong flow associated with it, head straight into our region.   Embedded in this flow there will be low pressure systems and fronts that will bring rain and wind every day or so.  Temperatures will warm into mid-forties each day, clouds will never leave us, and fog and frost will be far less likely--normal weather for us mid-winter.

I am deathly afraid that this pattern will end our chances of being the driest December on record.

Just to illustrate, here are two upper level maps at a level where the jet stream is generally strong (300 hPa, roughly 30,000 ft) for today and next Wednesday.   The shading gives the wind speeds. See the difference?  Ridge versus zonal flow.  You can think of the jet stream as the atmosphere's fire hose....and we will be on the receiving end.


 With strong zonal flow it becomes increasingly difficult to get the timing of weather systems right--so don't be surprised if forecasts are off by 6 hrs or so, particularly for forecasts a few days out.

On vacation and want to escape this onslaught?  Can't afford the exorbitant fares to Hawaii?  Head to southern California.  They will be sunny with temperatures heading into the upper 60s and 70s.  No rain.  Lots of sun.  Ironically, the ridge has brought us the dry, sometimes sunny weather, produced cooler than normal conditions in the SW U.S. since there is cool northerly flow to the eastern side of the ridge.   But with the ridge gone, southern CA temperatures will rebound.

And one more holiday gift....nearly all the long-range models indicate La Nina will disappear over the summer and next winter will have a very different character.  

Happy Holidays....

December 21, 2011

Where is La Nina?

A number of you have commented or emailed the same questions and comments that run like this:

" I thought it was a La Nina year--aren't they supposed to be wetter than normal"
"The National Weather Service said this fall would be wetter than normal--boy did they mess up!)

December is turning out to be one of the driest on record--in fact, there is a chance it could be the driest December since record-keeping began at a number of western Washington sites.

Take a look at the precipitation at Sea-Tac for the past 4 weeks (blue is normal, red this year):
Amazing...precipitation has almost been flat-lined since December 1--we are about 4 inches below normal, with only about .25 inches this month.

 In general, La Nina years are wetter during the entire fall-winter season....but that is only on average.  You can think of weighting a coin---instead of heads and tails being equally probable, heads is more likely.  Throw the coin ten times and it could be heads eight times--BUT you STILL will get two tails.

This year it is more LIKELY to be wetter than normal, but some La Nina years HAVE been drier than normal.

Here is a plot that summarizes the situation for Washington State.  The dots representation individual years, which can be El Nino (red), neutral (green) or La Nina (blue) years. The y axis gives the precipitation amounts for October through March.  Yes, the blue (La Nina) years typically have more precipitation than the other years.  But there is a considerable range for the La Nina, El Nino, and neutral years, with a number of La Nina years being relatively dry.   This year may well be one of them--although it is too early to know what the final winter's total will be.


You can think of NWS forecasters as casino operators---over a period of time the house will win, but occasionally someone can walk away with a jackpot.

But there is something else... a characteristic of La Nina years is the persistence of a major ridge in the eastern Pacific (see NWS graphic below).  Normally, that ridge is far enough west that we are in the


downstream trough...giving us cool, wet weather.  This year, the trough has been farther east than normal...giving us drier than normal conditions.  And we have seen the ridging day after day.   For some reason the ridge is shifted--and so we have been generally dry and cool.

The current model runs show a return to more normal, wetter conditions soon.

December 19, 2011

The Surface Data Revolution

An important change has occurred during the past decade that many are not aware of:  a huge increase in the number surface observations.  Go back 20 years ago and there were perhaps 1000 regular observations around the U.S., mainly at airports.  Roughly 30-40 regular observations over Washington State at primary and secondary airports.

 In contrast, today there are certainly at least 100,000 surface stations that report hourly and distribute their data in real time via the Internet over the U.S., and several thousand such observations over Washington alone.    In fact, there are so many observations available today, that if we plotted them all the weather maps would turn black with them over many parts of the Northwest.  Here is an example from earlier this year--there are a lot more stations available now:

So what has happened to provide such a treasure drove of information?  

First, there are many groups in the observing business right now...organizations that for whatever reason have established real-time observation networks.  Some local examples:  Seattle Public Utilities, the State AgWeatherNet, Washington State Ferries, Washington DOT, local private utilities, NW avalanche network, School Weather Networks associated with local TV stations, etc.---the list is long.  And then there are hundreds, if not thousands, of Northwest residents that has purchased capable weather stations and made their data available in real time via the WeatherUnderground or similar online services.

Which gets to the other parts of the revolution:  the availability of very good amateur equipment (like the Davis Pro weather stations) and the omnipresence of the Internet.  So for a very modest investment one can collect excellent quality information and make it instantly available to the world (something impossible two decades ago).

At the UW we collect more than 70 networks in real time, quality control and archive them, and make them available to all of you at our web site,  Here is a sample for Seattle right now (and our system does not plot every observation!):


 Interestingly, there are some places where there is several stations within a half mile, while gaps remain in others. 

This huge amount of surface data for the first time gives us insights into the local variations of surface weather features.   And enhances our ability to do very short term forecasting---called Nowcasting.  The national weather service also collects another of weather networks, through their MADIS system, and you can get at a lot of this information via their very nice web site:

http://www.wrh.noaa.gov/mesowest/gmap.php?map=sew


And this surface data revolution is just warming up.  Some new smartphones take continuous pressure measurements (as a way of getting height)--can you imagine if that data was communicated to a central site in real-time?  And it is matter of time before all cars have internet capability--imagine if each reported temperature and other weather parameters in real-time as they drive around.  And there is more. 

Although surface data is very useful, it is not enough.  Meteorologists need 3D data to forecast the weather since we need to describe the atmosphere's entire volume to run our models into the future.  And surface data often has problems--wind sensors placed behind an obstacle, temperature sensors too close to a building or not properly shaded; the potential issues are many.

Securing huge volumes of upper air data is another revolution...but one that will wait for a future blog.

December 17, 2011

How is the snowpack doing?

The short answer:  not too good.  Something that is surprising in a La Nina year, when snowpacks should be above normal.

Take a look at the latest snow water equivalent map for the west (this is the amount of water in the snowpack compared to normal). The Cascades are near normal due to the considerable fall received last month--but that snow is aging fast.  Oregon and Idaho:  well below normal.  California's Sierra's are roughly 25% of normal.  You want snow?--head to Arizona and New Mexico, where some locations are nearly 300% of normal.  This is due to the frequent troughs and cut-off lows that have moved into that region due to the persistent high pressure over the eastern Pacific.


 Talking of persistent---current models suggest the east Pacific ridging will remain in place at least for the next week--although with weaker amplitude.  This will allow occasional weak fronts to move through--such as the system expected tonight and Sunday morning.  Here is the latest 6-10 forecast from the National Weather Service's Climate Prediction Center---dry over the west.  With such east Pacific ridging, a lot of our moisture is going into Alaska, where they are getting hammered.


Here is the upper level chart for Christmas Eve.  The ridge is so large and high amplitude, Santa will be blown way up into Alaska.  Favorable conditions for dropping down a chimney---nice and dry.


 Talking of snow conditions, the frequent periods of clearing over the mountains have led to frequent deposits of hoarfrost (see picture below).  The is important because when snow does return, such frost  result in an underlying weak layer that could lead to avalanches.  But we can worry about that later.

December 15, 2011

Drought

 The Driest First Half of December in Seattle History!

Extremes of any type are interesting and right now we are in the midst of an unusual December drought.   At Sea-Tac Airport as of Wednesday night we had only gotten .03 inches so far this month, 2.51 inches BELOW normal.  Spokane has had .02 inches, 1.09 inches below normal.
Checking out the record at Sea-Tac, it appears that we have experienced the DRIEST FIRST TWO WEEKS ON RECORD at that site.  Wow.

Perhaps the best way to appreciate the situation is with maps showing the percent of normal rain over the past 14 days.  Reddish colors indicate less than 25% of normal.  Most of the west is red!  And a great deal of the West had less than 5% of normal for the past two weeks.

 Or you can look at the departure from normal precipitation over the period (see below).  We are down more than two inches over the entire western side of the Cascade, with far larger deficits in the mountains.

There is some light rain this morning, but that won't be enough to change the story much.  By 7 AM Sea-Tac has received only .02 inches and the Langley radar shows nothing offshore.  The problem, of course, is the extraordinarily persistent ridge over the eastern Pacific....and though ridge is weakening a bit (allowing some weak and splitting systems to influence us), it should still be in place for a while.

The other side of the coin is that we have been unusually cold... here is the difference of the maximum temperature from normal for the past two weeks...virtually all of Washington State except the Cascades and the eastern slopes are well below normal (by 3-6F).  Some folks are claiming we will have the driest or coldest December on record....I think they are premature.....but the first half has certainly been unusual, and a contradiction to at least one expectation of La Nina, during which entire winter season is usually wetter than normal.

 
My Lost Dog:   There have been several more reports of my dog in Mountlake Terrace...if you live up there and see her, please let us know RIGHT AWAY! (contact information at the right).  She has been living as a wild animal for nearly three months now.  Either someone has to take her in and call us, or we need a fresh report to rush up there immediately.  Of course, we have been searching ourselves a great deal.  An issue is the town of Mountlake Terrace, which has been tearing down our signs even when they are on private property. 

December 13, 2011

Surface, Air, and Soil Temperatures: The Differences Can Be Large and Important

Meteorologists have more than one temperature reported at or near the surface and knowing the difference between them can save your live or your crops.

This blog will describe them and show you some recent examples.

First, some temperature 101!  When  a TV weathercaster gives the temperature at some location (Sea-Tac, Portland, Wenatchee, Forks, etc) or you get the temperature from some weather web site or app, at what height is the temperature?  The answer is generally about 2 meters (roughly 6 ft), the standard height used for temperature sensors (here is the NWS temperature sensor--the white thing with the dome top):


When you get an air temperature from the sensor in your car, the height is generally about half the official height...roughly 2 feet.

Some locations measure the surface temperature---the actual temperature of the surface.  Sometimes they use a sensor in a road or on the surface of the ground, other times they use infrared thermometers--like the ones used in doctor's offices to measure the temperature in your ear.  Here is an example--they are called infrared radiometers:

Finally, a number of weather observing sites, particularly agriculturally oriented locations, measure the soil temperatures at one or several depths:

Now here is the interested part---these three temperatures... measured only feet apart in the vertical...can be very, very different, and the differences depend on season and time of day.

During a relatively clear, low-wind period, like we have had the past few weeks, when there is good radiational (infrared) cooling to space, the ground cools off rapidly at night.  In such situations, the 2-m air temperature can be 2-8F warmer than the surface.  On the other hand, temperatures in the ground are generally much warmer in such situation, and the deeper you go the warmer the subsurface gets.  On the other hand, during the day, and particularly during the summer, the surface gets heated by the sun and can be MUCH warmer than either the air temperature or the ground temperature.

Not many locations have all three sensors (air temperature at 2 meters, surface temperature, ground temperature).  One network that has both soil and air temperatures is the Washington State AgriWeatherNetwork, run out of WSU in Pullman (a wonderful collection of data and a great investment by the State). Here are the air temperatures (2-m) around 10 AM this morning...20s in eastern WA and low 30s in the west.
 

Take a look at the soil temperatures at 8 inches into the soil.  MUCH warmer...low 30s in the east and mid to upper 30s in the west...even some low 40s.  Why are the soils warmer?  It takes time for the cold to spread into the soil.


To show this, here are the soil temperatures for the AgriWeatherSite in Woodinville over the past month. A general slow decline in temperatures over the past two weeks of cold from the mid-40s into the upper 30s.  The daily heating/cooling cycle is really damped down in the soil. The farther you go down, the less daily temperature change.


What about the surface temperatures?

Here is a comparison of the surface and air temperatures at Marblemount, Washington for the past few days (times in GMT):

During the night, the surface temperatures (blue line) can be 5-7F less than the air temperatures, while during the day, the air surface and air temperatures are more similar, with the ground temperature even getting warmer for a while.

Last night I went outside with an infrared radiometer measuring the surface temperatures outside my house and comparing it to the 2-m air temperature (which was 30F)--yes, my neighbors are used to my quirky behavior.  My concrete driveway was 27F and the grass was around 25F.  Why was the concrete warmer?  It was getting some heat conducted up from below, while the grass had some air space below to lessen upward conduction of heat.

Can this information save your life?  You bet.   As I have mentioned before, the greatest  weather threat to your life is probably roadway icing.  On cold, relatively clear nights, the road surface temperature can easily be a few degrees cooler than the 2-m air temperatures.  So if reported temperatures are below 35-36F, you better be careful--the road could be at freezing or below.  If the temperature sensor on your car is below 35F, better be careful.

For the gardener, don't think that you don't have to worry about protecting frost-sensitive plants if the temperatures are above freezing. Protect when temperatures are below 35-36F.

Reminder:  If you need a new calendar for 2012 please consider the Washington Weather Calendar--available at:  http://www.weather-calendar.com/washington/
Buy three or more and you get free shipping.

One dollar from each calendar goes to supporting the student chapter of the American Meteorological Society!

December 11, 2011

Fog Outside, Desert Humidity Inside


It it wet outside, dripping wet.  Drizzle and fog.  Relative humidity near 100%.  The air is holding every bit of water vapor it can.  And its cold outside  as well...perhaps in the 30s, like most of the last few days.

But the strange thing is that inside the air is as dry as a desert, with relative humidities down into the teens or less.   You walk on a rug and touch a door knob or piece of metal and ZAP...a spark!  Your skin feels rough and uncomfortable from the low humidity--perhaps you get some skin cracks on your feet or hands.   Your throat feels dry.

How can this be?  How can the humidity outside be near 100% while inside its is more like the Mojave Desert? 

Well, it all has to do with the amount of water air can hold as temperature varies.

The amount of water vapor a volume of air can contain (hold is really the wrong word) depends greatly on temperature...in fact, it increases very, very quickly (exponentially!) with temperature.  Warm air can contain a LOT more water vapor than cold air.  Here is a plot to show you the story:


You are stuck with degrees centigrade...this is science!  The y-axis is the saturation mixing ratio--the number of grams of water vapor per kg of dry air--for saturated air as temperature varies..  At 0C there is only 4 grams of water vapor per kg of dry air, while at 20C (68F) there is 15!.

Lets say the temperature is 0C (32F) outside with a relative humidity of 100%...the air is cold and saturated...EXACTLY what we have been "enjoying" lately.   Your house or apartment has a heating system that warms the air up to say 68F (20C).  The interesting thing is that your house or apartment is hardly air tight and air from the outside is continuously moving inside and heated.  On average there is about one complete air change per hour, more for leaky older homes, less for newer homes built tight.

Anyway, using the above chart, the 100% outside saturated air has about 4 gram of water vapor per kg of dry air.  Now you bring it inside and heat the air.  Inside, the air has the same amount of water vapor that is started with--4 g per kg of dry air.  At 20C the saturation mixing ratio is now roughly 15 g per kg.  The air now can hold MUCH more water vapor than it started with and the air is no longer saturated..not even close!

The relative humidity is defined as 100 times the amount of water vapor in a sample of air divided by the maximum about of water vapor that air can hold at that temperature.
 So in this case we get RH = 100 * 4/15 = 27%  Wow...that air is now very dry in the sense the relative humidity is much lower (remember, it still has the same amount of water vapor)

What happens if you heat your home to a temperature above 68F?  Or if the temperature outside is colder than 32F?  Or if the air outside does not start off completely saturated?  The relative humidity would be much lower...and it is quite easy to get relative humidities down into the teens and single digits.

Supposedly relative humidities of 30-50% are the most healthful. Some people hate the dryness so much they put small water sprayers into their furnace or purchase humidifiers.  Or use lots of creams to create a protective barrier on their skin.

December 09, 2011

Amazing Fog Pictures and Inversions

 Special Eclipse Forecast: I got up at 5 AM...and saw the eclipse begin...
 

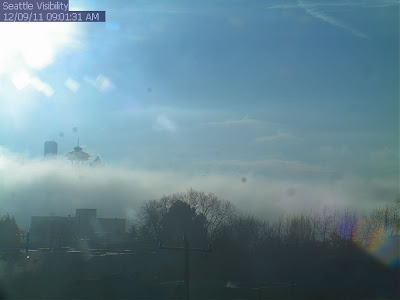
Last night we developed a very strong inversion and a shallow fog layer that has now mainly burnt off.  At daybreak many land areas around the Sound had fog, while large areas of the Sound were clear.

Here is an extraordinary picture sent to me by Tracee Geernaert at a location on Salmon Bay, looking to the north.  You see those wave-like structures---reminiscent of breaking waves on a beach?   Stunning.  Those are examples of Kelvin-Helmholtz Instability (KHI) waves that are produced when there a very large change in wind with height over a layer of the atmosphere that is stable.


These are also called billow clouds.  Here are a few more examples:


Such clouds can be associated with substantial turbulence as they roll up and break.   Often quite turbulent to fly through.   A few years ago I was sitting in a window seat on an aircraft and saw those clouds ahead of us.  I told the person next to me that it would be a good idea to put on her seatbelt.  She laughed at me.  A few minutes later we hit moderate turbulence.  She wasn't laughing anymore.

Some beautiful shots this morning of the sun and shallow fog from the Queen Anne and Space Needle cams:


 Last night warm air moved in aloft and offshore flow increased.  As result the inversion aloft really cranked up.  Here is the temperature structure at 8:30 AM this morning over the Puget Sound region:
Around 30F near the surface, but in the mid-50s above 2500ft.  Very strong inversion!  Want to hear something amazing? The temperature right now (1 PM) at Mowich snotel site west of Mt. Rainier, at an elevation of 3150 ft, is 62F!  And it is 50F at Paradise on Mt. Rainer (5500ft).  Can you imagine?  You could be hiking in bright sun in 60F temperature right now!

Let me end with an extraordinary shot this morning  of the fog from Peter Benda's house at 1100 ft in Bellevue

December 07, 2011

High Pressure Produces Low Sea Level

During roughly the past week, sea level pressure has been unusually high--including the record-breaking high pressure observed on December 1 (1043.4 hPa).   Here is the pressure of the last four weeks.  The first three weeks had relatively normal sea level pressures (1000-1020 mb), but the last week or so, pressures have generally ranged from roughly 1030-1035 mb.   Very unusual to stay that high for so long.

We have also been observing another anomaly:  the height of the water levels in the region have been unusually LOW, particularly along the Pacific coast.  NOAA produces water-level predictions = (the tide tables we know so well) and these predictions are generally quite good, since we understand very well what produces tides and their periodicities.  But recently the tide predictions have been greatly in error, forecasting tides that are much too high by one or two feet!  Here is the predicted and observed water level at Neah Bay, provided to me by UW's Dr. Nate Mantua.


Turns out these two anomalies (high pressure and low water levels) are directly connected, with high pressure pushing water levels down.

The general term for this mechanism is the inverse barometer, and is often used to explain unusually high water levels when low pressure is over a water-covered area (see graphic)--and you may

remember that I wrote about this a few years ago when record low pressure spread over the west coast (click here for my past blog).  In general,  the water level should sink around 1 cm for every mb pressure increases. We have experienced about a 20 mb high-pressure anomaly, and thus one would expect water levels around 20 cm (8 inches) below normal.

However, there is something else going on here.  The center of the high pressure has generally been offshore and as a result northerly winds have been persistent along the Northwest coast (see graphic from WRF model forecast):

Northerly winds put a force on the water to the south, but because of the Coriolis effect, there is an offshore component to the surface currents.  Thus, surface currents are pulling water AWAY from the coast, further reducing the height of the water surface. 

And it is better than that if you like low water levels.  With a complete absence of storms there are no strong winds pushing water up on the coast and very weak wave action.  Take a look at the wave heights along the Washington and Oregon coasts at two NWS coastal buoys for the past five days (46041 off of WA, 46050 off of Oregon).  Waves progressively decreased to 4-5 ft.  Good time for fishing?


We will be stuck in this pattern (high pressure, low clouds west of the Cascade crest, air pollution) for several more days, so you better get used to it.  Want sun, head into the mountains or eastern WA or OR.

PS:  If you want me to answer a question on-air on KPLU on Friday at 9 AM, you can leave it at this link.

A Major Cyclone Will Approach Our Coast But Not a Repeat of November 19

A very strong, rapidly developing, midlatitude cyclone will approach the Northwest coast on Friday and move through on Saturday. Fortunately...