January 30, 2018

Don't Give Up in Watching Tomorrow Morning's Eclilpse!

In only a few hours, a very special total eclipse of the moon will begin.  That is a Supermoon, Blue Moon, Total Lunar Eclipse.    The moon is now a supermoon, larger than normal because of its relative close proximity to the Earth.  And it is a blue moon, because we will enjoy two full moons this month (the definition of a blue moon).  As shown by the table below, the total eclipse will run from 4:51 AM through 6:07 AM.


There has been a lot of talk about clouds ruining the viewing, but I think there is a real chance for those of us in Puget Sound to get a glimpse of the total eclipse sometime during totality.

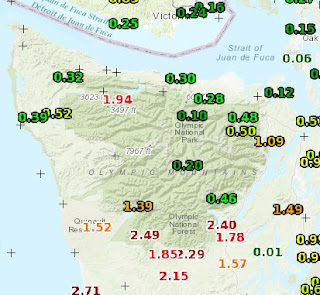
We are fortunate to have westerly flow over the area, which means that central and southern Puget Sound  probably will be in the rain/cloud shadow of the Olympics.   The 8:30 PM weather radar imagery tonight  shows the rainshadow over Puget Sound clearly (see below).


And the infrared satellite imagery at roughly the same time, shows the approaching showers, but some breaks over the south Sound.  Not good over the windward (western) slopes of the Cascades, but much better over the Kitsap Peninsula.

The UW WRF model produces a cloud image that is mean to simulate what a satellite image would look like.  The forecast for 4 AM shows a mixed band over Puget Sound (there are breaks) and very good conditions east of the Cascade crest.  So if you really want to view the eclipse, head over to Ellensburg.


As I have explained a number of times in this blog, one should never look at a single forecast, but rather make use of an ensemble of many prediction to get an idea of probabilities.  Here is an ensemble of cloud forecasts for 4 AM tomorrow.  Some of the ensemble members have clouds, some don't.  Some have a veil of a thin mid-level deck of clouds.


Based on all these forecasts, I suspect that the odds of seeing the eclipse from Seattle to Olympia between 4 and 6 AM is around 50-50.    Good enough to be worth getting up to see an astronomical spectacle that won't be visible for a very, very long time.

January 29, 2018

It never rains in California?

There is a well-known song about it never raining in southern California and during the next ten days folks might give that music a listen.  Why?  Because it won't be raining there any time soon.


Here is the NOAA/NWS GFS accumulated precipitation for the next tens days.
Washington get plenty, as does northern Oregon.  But virtually nothing over California, Nevada, and Arizona.


OK...that is only one run.  What about the 21 member ensemble of forecasts (called GEFS)?  Here they are in what is called a plume diagram....none of the members show rain!

So what is going on?   

A persistent area of high pressure will develop over and and west of California.

For example, here is the upper level (500 hPa) forecast for 10 PM Friday.   Nice ridge west of California, but not enough amplitude to keep the Northwest out of clouds and some rain (this is known as a dirty ridge by local meteorologists).


And here is the average anomaly from normal of the 21 ensemble forecasts for the same level, but for the 240 hr forecast---unbelievable, a big ridge over the western U.S. (red and orange show above average heights)


Mama Mia! This is one persistent ridge!  Not good for skiers in the Sierra, who have enjoyed substantial new snow during the last week.

Now some folks are claiming that such persistent high pressure areas have become more frequent or persistent in the West.  Some even have a name for it:
the Ridiculously Resilient Ridge (RRR).   And a few individuals are claiming that it is due to global warming.  OK, let's check out their claims:  is such a feature becoming more frequent or intense?

So what I did was to go to the wonderful NOAA ESRL web site and examined the average 500 hPa heights (same level as above) over the western U.S. (see the region selected below) for the last 70 years.
Below is the long-time series of the 500 hPa heights for November through February.   Quite a bit of ridging (high pressure) during the 2015-2016 winter, but little trend since the mid-1970s, when there was a major switch in sign of the Pacific Decadal Oscillation (the dominant mode of long-term natural variability over the eastern Pacific).
What about near-surface trends?  Here is the time series for 1000 hPa heights for November to February (essentially the same as sea level pressure).  No long-term trend.


You can do this exercise for different West Coast regions or seasons and you get the same answer (I have tried many combinations)....there is no long-term trend in West Coast high pressure during the past half century. 

We have an anomaly the next few weeks, but there is no reason to expect that is represents  a persistent feature of our future.

January 27, 2018

Strong Winds, Followed by the Unusual: A Decent Warm Front in the Northwest

The models did a good job today, highlighting the passage of a modest low to the north of Puget Sound.  The NWS analysis below shows the position of the low (1002 hPa) at 7 AM this morning (Saturday).  The track (SW to NE, passing across the tip of the Olympic Peninsula) is the perfect one to get winds around Seattle--so even a weak low get notice.


Here are the max. gusts during the past 24h (only gusts greater than 31 mph are shown).  Lots of gusts into the 40s mph around Seattle and 50+mph in the Strait and northern Whidbey Island.  Some exposed locations in the Cascades hit 70-80 mph.

Several thousand customers lost power around the region, but nothing serious.

Now the next story is the passage of a warm front through the region tonight and tomorrow morning.    Here is the forecast sea level pressure, 925 hPa (roughly 3000 ft) temperature (shaded), and winds for 1 AM Sunday morning.   I have indicated the warm frontal zone with the blue oval. (click on image to expand).


Look closely and you will see that the warm frontal zone is associated with a major temperature change, with warmer temperatures to the south. Wind direction shifts and the front is associated with lower pressure (a trough).   This feature is moving north, so we will be transitioning to warmer air

 Beautiful warm fronts like this are unusual in our region...just a few a year.  What we do get are a lot of warm occluded fronts, which are a hybrid warm/cold front.   Cyclone and fronts go through a typical life cycle (see figures), starting as a frontal wave and ending up as an occlusion (purple line).  The warm front (red line) is most evident at the early stages: occluded fronts during old age.


The trouble is that the systems we get tend to be old ones, with their origins well to the west of us.   So we generally experience aging occlusions, and not nice warm fronts like the one that is passing up our coast tomorrow AM.

We will get substantial rain as the front moves through Sunday morning, but things should dry off to the south by mid-day.  But feel sorry for the poor folks in southern BC--the warm front will stall there and there should be lots of precipitation over Vancouver Island and the southern BC mountains. 

To illustrate, here is the 24 hour total precipitation ending 4 AM Monday.  5-10 inches of rain along the Vancouver Island coast.  The Olympics and northern Cascades will catch a piece of this.   Whistler's lower slopes will be a swamp.

Good time to head to Mt. Hood or Batchelor to ski.


January 25, 2018

Pacific Cyclone Makes Landfall on Vancouver Island Tomorrow Night

I have an admission to make.  The weather this winter has been boring, without much major action. 

You know what I mean:  no big windstorms, crippling snowstorms, heavy rain or extensive flooding.  That kind of thing. 

One way to see this is to plot the (sustained) winds at Sea-Tac Airport for the last 12 weeks (below).  One decent event in mid-November (sustained winds reaching 32 knots), and pablum after that.  Boring.

For those of you who like weather action, things will improve late tomorrow ans Saturday, but even the upcoming event will only be a modest blow.  But we must take what meteorological scraps are offered to us by the weather gods.

Let me start by showing you the pressure forecasts for the next day or so.  The forecast for 10 PM Friday night looks promising, with a modest low center (a Pacific cyclone of 997 hPa) off our coast.  A strong pressure gradient on the Oregon coast....the will be ground zero for strong winds tomorrow evening.


By 8 AM Saturday, the low center will be making landfall on south/central Vancouver Island, with lots of pressure gradient and winds along the Washington Coast.

 At 1 PM to low will be moving due north of Puget Sound...that is when the strong wind will be hitting Seattle and vicinity. Why?  Because there is a large difference in pressure up the Sound.


Want to see the wind forecasts?   At 10 PM tomorrow, sustained winds as high as 45 knots are predicted about the Oregon coast.


And three hours later, strong winds will hit the Washington coast, with very strong easterlies in the western Strait of Juan de Fuca (see image).  Essentially, the air is accelerating towards the offshore low within the Strait.


The strongest winds will hit central Puget Sound around 1 PM Saturday, something suggested by the UW WRF model forecast (see below), with gusts of 40-50 mph predicted. (Graphic from Seattle WindWatch).


OK...this is one forecast.  Perhaps I should not get too excited... a small error in location of the low will have a major impact, and, in fact, the National Weather Service SREF ensemble of many forecasts has a huge amount of variation among the solutions of their forecast models, from 4 to 26 knot sustained winds during mid-day Saturday over Seattle (see below).  So there is considerable uncertainty still in this forecast.


Anyway, we can watch the models tomorrow to see if they stay with this storm.

January 23, 2018

How could the precipitation be the same in the mountains and Puget Sound?

Precipitation is always heavier in the mountains.   True?  
Not necessarily.

The spatial pattern of precipitation is always the same in western Washington.  
Not true. It depends on wind direction, wind speed, stability of the air and more.

The precipitation distribution can be complicated around here, but a little NW Precipitation 101 can explain much of it.

Let's start with the precipitation over the past 24h (ending 6 PM Tuesday).  A lot of rain in Seattle (about .70 inches).  But about the same in Snoqualmie Pass at 3000 ft, and at many Cascade locations.


How can that be?  Isn't precipitation always heavier at higher elevations?

Well a big issue for mountain precipitation is the wind direction.   The Cascades are a north-south terrain barrier.   When air moves perpendicular to the mountains (say from the west), it is forced to rise on the western slopes, which results in major precipitation enhancement (see figures).


But if the air is coming from the south, it won't be forced to rise by the Cascade slopes, and thus there is little mountain enhancement (see below)


Guess what the winds were like today?  They were southerly (from the south)....something that is shown by the winds at Sea-Tac Airport below (this figure shows time on the x-axis and height on the y-axis, with wind barbs and temperatures).

That is why Seattle and the mountains had similar amount of precipitation!

But what about the Olympic Mountains?  There is a HUGE difference in precipitation between the southern and northern sides (see blow up). Up to 2.5 inches on the south, but a quarter inch on the NE side.  Why?  Those southerly winds!

 
Because the Olympics are a somewhat circular barrier, southerly air is forced to rise on the southern side,  producing heavy precipitation.    But then it sinks on the northern side, causing warming and drying....and much less precipitation.

So today is a good example of the precipitation distribution for southerly winds.

What if the winds were westerly (from the west)?   You might get a precipitation distribution like this (see below), with large amount of precipitation on the western sides of the Olympics and Cascades, and much less over Puget Sound (which is then rain shadowed by the Olympics).


So wind direction is important.    And other factors can come into play, like the stability of the air (the tendency to rise when given a little push upwards).

When air has low stability or nearly unstable, a little lift up can cause the air to become buoyant and convect...producing a heavy convective shower or even a thunderstorm.  This often happens at the bottom of slopes.

Ever hit very heavy showers near North Bend when driving eastward on I-90.  Such an instability shower is probably what was going on.   If the air was more stable, the heavier precipitation would be up the slopes somewhere.


Pretty complicated stuff!  That is why meteorologists get the big bucks. 😃

January 21, 2018

Very Strong Cold Front Crosses the Coast

Sometimes you see an image that really gets your attention...and the radar image this morning from the Langley Hill radar (near Hoquiam) was one (see below).
This image shows reflectivity, which is related to precipitation intensity--with higher values (pouring rain or hail) shown by red.

A very strong front is seen, with the red lines indicative of a narrow cold frontal rain band, which is found at the actual location of the cold front.

Do you see how the red line is corrugated, with heavier areas and gaps?   This is characteristic of the very strongest fronts, and produced by an instability associated with strong shear across the front.   Just amazing.


Below is a blow up to give you a closer look.  This intense cold front is associated with a temperature change (colder behind), a trough of low pressure, and a very rapid wind shift--from southerly in front to westerly behind. 

The frontal characteristic are not uniform along the front, but are much stronger in the red areas, compared to the break locations (known as gaps).


The National Weather Service has some coastal buoys that can show us what the transition was like at the surface. At Buoy 46041, just off the WA coast, the pressure (green line) fell rapidly until 15 GMT today (7AM), and then rose very rapidly.   Wind gusts (red lines) increased to 47 knots, before plummeting after frontal passage.


At the same buoy, there was a sharp wind shift  from southerly (about 175 degrees) to southwesterly (roughly 240 degrees) with frontal passage (see below).  Temperature dropped several degrees with frontal passage (not shown).


As suggested by the 2 PM visible satellite figure, the front was over the Cascades at that time, with very cold unstable air behind it (strong convective cells are seen over the Pacific as colder air went over warmer water...which makes for big instability).


As a numerical modeler, the first thing I looked at was the simulation that started last night at 4 PM.  

Did it get the strong front?  It did.  

Here is a 16 hour forecasts for the very highest resolution run at the UW (1.33 km grid spacing) for pressure/wind and precipitation/wind, valid at 8 AM Sunday.  Sharp wind/pressure transition and even the hint of the corrugated precipitation pattern in the right hand figure.  Impressive

 
All that instability and convection should produce significant snow over the Cascades during the later afternoon and evening.

January 20, 2018

Newest Cloud Types Seen in the Pacific Northwest

In  March 2017, an updated International Cloud Atlas was released and several new clouds were added. 

One new cloud is Asperitas, characterized by a complex wave-like base.   This week (January 17th), James Dearman sent me this wonderful shot of an Asperitas cloud that he took near Vancouver, Washington (see below). 

Pretty amazing cloud, with undulations looking like a sea surface turned upside down.


Here is another example from Virginia:


These clouds result from wave-like motions in the atmosphere that distort a pre-existing cloud deck.   Such waves can be initiated by fronts, thunderstorms, or some other type of atmospheric disturbance.  Generally no precipitation or severe weather with these clouds--but they do look scary.

Folks normally don't think about it, but the atmosphere is full of waves.    Generally, the atmosphere is stable, meaning if you push an air parcel upward, it will want to return to where it started.  But like a swing set, the air parcel tends to overshoot and goes into an oscillation.  A pendulum is another example.


Another new cloud is one we have talked about in this blogCavum, or the hole punch cloud (see below).   These "holes" are produced when an aircraft goes through a cloud made of supercooled water (liquid water below freezing).  The passage of the aircraft through the cloud causes a transition to ice crystals, which subsequently fall out, leaving a hole.


January 18, 2018

Big Waves Hit the Northwest Coast from an Immense Storm Offshore

The Washington Coast is being pummeled by unusually big waves, some as high as 30-40 feet!  For example, buoy 41, right off the central WA coast observed a significant wave height of over 30 ft (see plot and map below)


Buoy 50, right off of Newport, Oregon, got to 35 feet this morning.


And a Westport surf cam shows an angry sea.


Or this scary video from Westport taken by Bryan Benoit:


My colleagues at the National Weather Service currently have coastal flood and high surf warnings up for the Washington and Oregon coasts.

 The National Weather Service runs a wave prediction model, called WaveWatch III, the predicts wave heights (using weather prediction models to drive the wave model).  The WW3 forecast of significant wave height for 1 AM last night predicted a slug of very high waves of 13-14 meter height (43-46 ft) approaching our coast.

No wonder my friends at the National Weather Service had warnings out!

Here is a blow up of the predicted waves at the same time.
Why such big waves?  Because there is a HUGE, intense, and slow moving storm (midlatitude cyclone) over the northeast Pacific.

I mean a stunningly big storm.  Here is an infrared satellite image last night...you can see the immense swirl of clouds circling the system.


The sea level pressure analysis at 4 PM Wednesday shows the extraordinary system, with a central pressure of 964 hPa....very deep for a low that far south.

You notice the extreme pressure gradients around the storm, particular on the south and west sides?  Those are associated with very strong winds.
In fact, the surface wind forecast from the UW WRF model for 7 PM Wednesday, indicates SUSTAINED winds of 50 knots around the south side of the storm.

Wind waves depend on the strength of the winds, the distance the winds are blowing over the water (the fetch), and the length of time the winds work on the water.

With a huge, intense, slow-moving storm like this, all of these elements are maximized to produce big waves offshore, which propagate away from the storm (and towards us) as swell.

Be very careful if you go wave-watching on the coast.  Sneaker waves can come in and inundate previously dry locations. 

And I hope that no cruise ships are in the area....😉.  In fact, the latest real-time ship tracker image shows virtually no ship traffic in the region of strong winds and big waves...

Should I Let AI Write My Blogs?

I spend a lot of time thinking about and writing my blogs.   Could AI apps do the work for me?   Could any of you tell the difference? Well,...