On Thursday, at approximately 1:35 PM PST, an Alaska Airlines flight (ASA 700) flying at 33,000 ft between Seattle and Phoenix, hit severe turbulence near Las Vegas, dropping approximately 200 ft over a few seconds. Several flight attendants and one passenger were injured.
What is the meteorological explanation and could this unpleasant event have been avoided?
A few details first. Below is the flight path, with the star showing the aircraft's location when severe turbulence hit. Weather radar is also shown (color shading). There was no precipitation in the neighborhood.
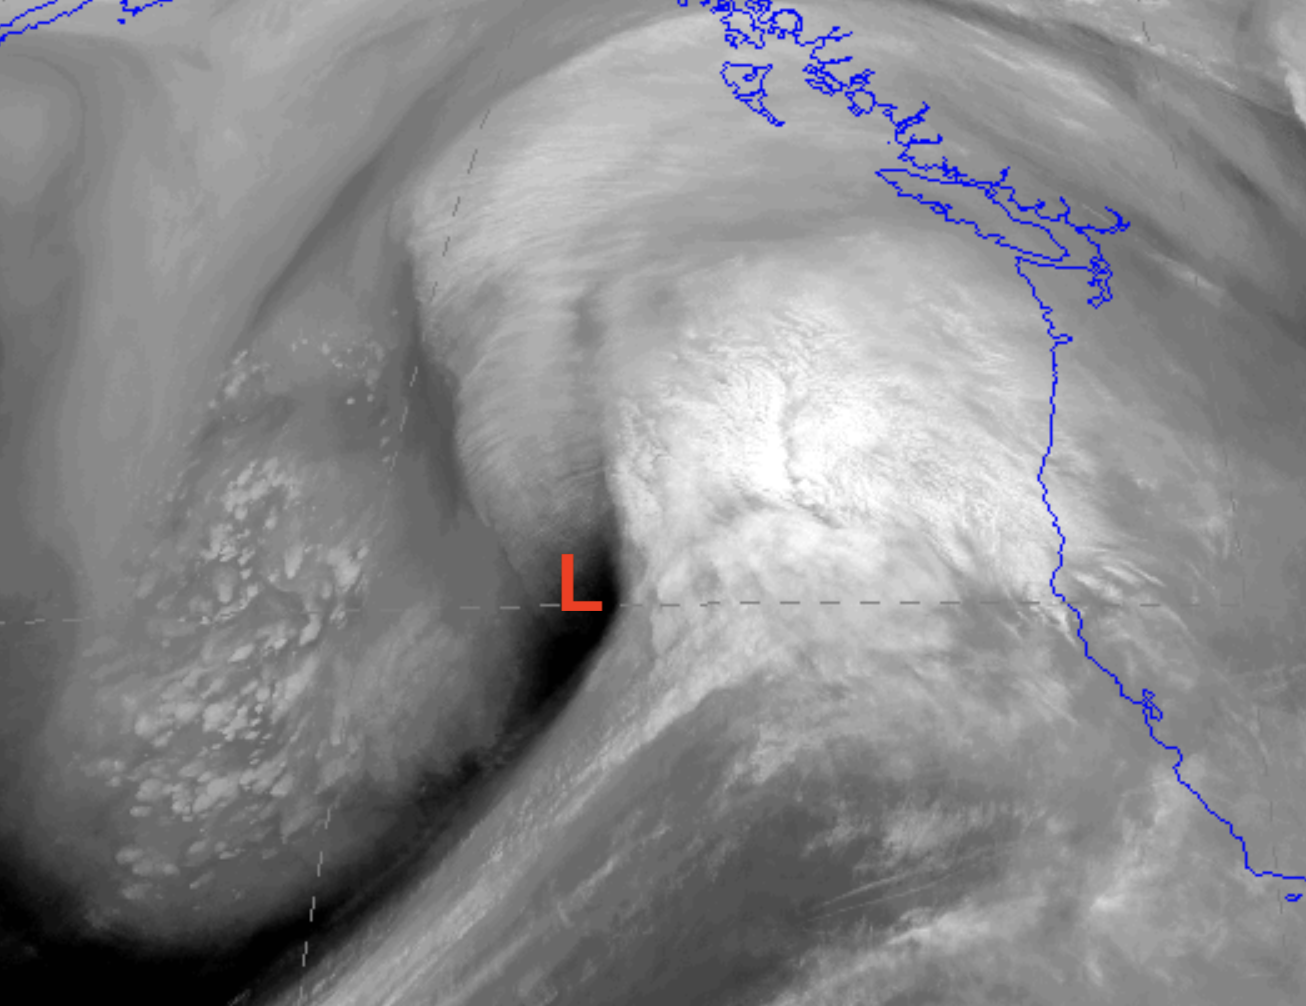
An infrared satellite image at this time (below) shows that the turbulence occurred in an area of mid-level clouds. It appears that the plane was probably not in clouds so this was a clear air turbulence event.
Turning to information provided by the NOAA Aviation Weather Center, below are the turbulence reports for the few hours ending at 2 PM. The double red triangles indicate extreme turbulence. The one associated with Alaska Airlines aircraft is indicated, but there are three others at altitudes ranging from 25,000 to 38,000 ft.
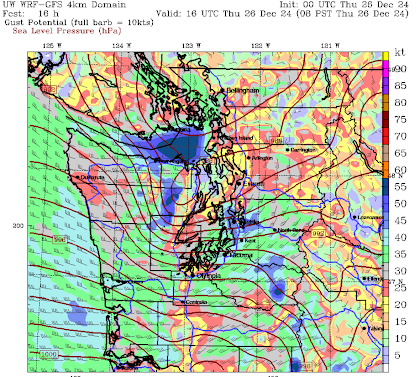
The shading indicates the forecast turbulence levels by a NOAA prediction system driven by model forecasts of wind, temperature, and other parameters.
Let me show you the predicted turbulence at the time of the accident at 30,000 ft (below). The prediction for 36,000 ft was similar.
A band of moderate turbulence was predicted over the region and well-positioned with the locations of the incident. But the forecast underplayed the intensity.
What was the origin of the turbulence?Clear air turbulence like this can have two origins: large vertical changes in wind speed or direction (wind shear) or breaking mountain waves (atmosphere waves produced by air flowing over mountain barriers).
Considering the location (red pointer) of the incident compared to the local terrain, I concluded that the potential for strong mountain waves was small. Winds approaching the crest level of the upstream mountains (about 7000 ft) were too weak, among other problems.
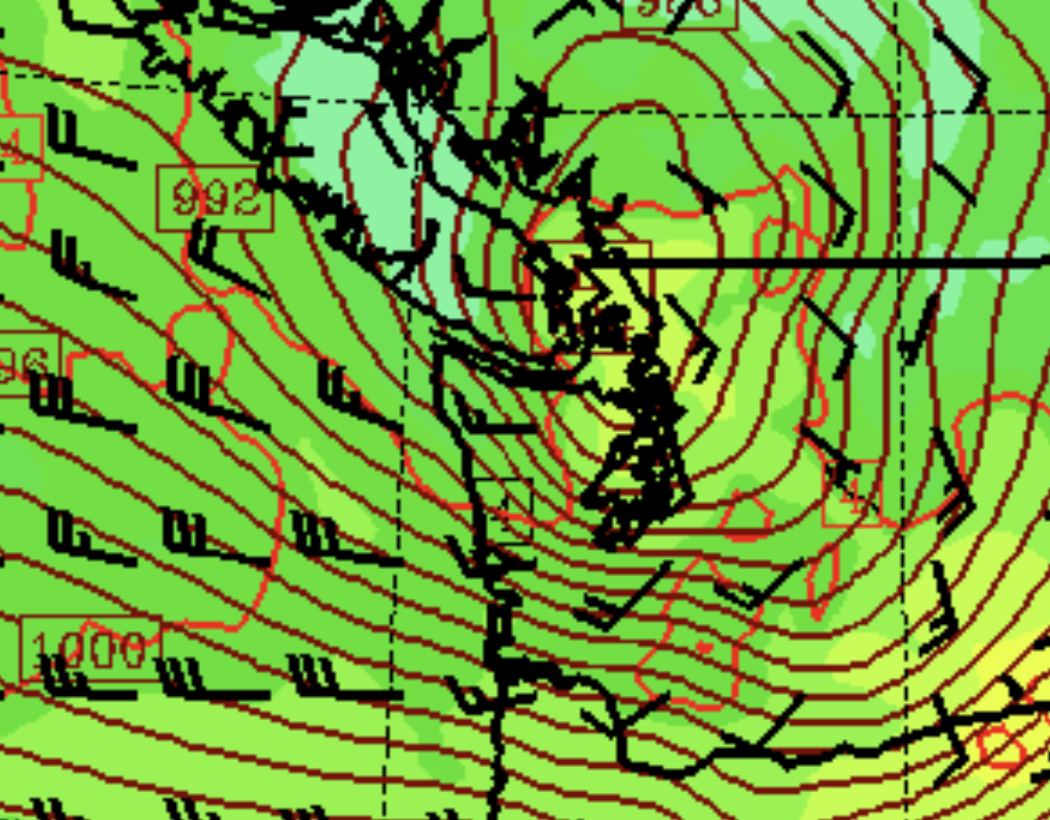
Next, I plotted the forecast winds at roughly 35,000 ft, just above the height of the aircraft (33,000 ft). (see below).
OMG. At 4PM (0000 UTC) there was a very strong jet stream, with winds exceeding 150 knots. At the time of the incident, this band of winds would have been perfectly positioned to produce very strong winds above the site of the incident.
Strong winds in themselves don't produce clear air turbulence, which often results in large changes in the wind with height---or vertical wind shear. However, having strong winds aloft can produce a strong wind shear if the winds decline rapidly below.To determine whether there was strong vertical wind shear, I plotted the radiosonde observations at Las Vegas at 4 PM that day (below). The balloon is actually launched around 3 PM and takes about 2-h to ascend.
If you can't read the wind barbs at the right, let me translate.
There was a huge wind shear in the vertical at the elevations of the Alaska flight. The aircraft was flying at approximately 33,000 ft (about 10,000 meters). Winds increase from about 50 kt around 7500 meters to over 150 knots around 11,000 meters.
Let me make this even easier with a plot of wind speed versus height below. The arrow shows you the rough elevation of the aircraft.
Mama Mia! That is some real wind shear.
Another factor is that the stability of the air in the layer traversed by the plane was low (you will have to trust me with this, but meteorologists in the crowd will look at the temperatures plotted above (right black line) will not be in agreement.
This kind of strong vertical wind shear and modest stability is what is needed for clear air turbulence. These conditions cause the atmosphere to develop intense turbulence motions that result in strong vertical accelerations of aircraft.
What Can Airlines Do?
Pilots often tell folks to use their seatbelts if reports of strong turbulence are observed in their vicinity. On Thursday for this case, there were no severe turbulence reports before the incident.
There were forecasts of moderate turbulence, but those are not rare and generally not a serious issue. NOAA turbulence forecasts are useful, but often miss the mark, particularly for severe clear-air turbulence, something I can explain in a future blog.
Perhaps passengers should always be told to buckle when moderate turbulence is predicted or when traversing a region of large predicted wind shear, with cabin service discontinued.
One day, effective turbulence sensing systems should be installed on all passenger aircraft, so that planes can be warned of such turbulence ahead. Doppler Lidar is one potential technology.
Perhaps, a reborn Boeing could make use of this technology in new aircraft. 😊
_________________________________________________
Steve Pool Scholarship Fund
We are over halfway to our goal of the $100K needed to create a permanent undergraduate scholarship in honor of Seattle's most well-known weather communicator, the late Steve Pool.
Please consider making a contribution (tax-deductible) to this University of Washington fund. And thanks to the hundreds of folks who have already contributed.
Here is the info:
A Steve Pool memorial undergraduate scholarship has been established in his honor (see below)
Once funded by contributions, this new undergraduate scholarship will provide financial assistance to promising Atmospheric Sciences students, fostering the training of the next generation of meteorologists and atmospheric scientists.
If you want to contribute or learn more about Steve, check out the webpage below. Thanks so much....cliff


.png)


.gif)


.gif)


