Let me show you a few samples. Let's start with a visible image around 11 AM Sunday morning centered on the Pacific Northwest. You can a north-south oriented frontal band off our coast and relatively clear skies over the Columbia Basin. But over far eastern WA and northern Idaho there is a a nice example of lines of cloud streets, with regular spacing.
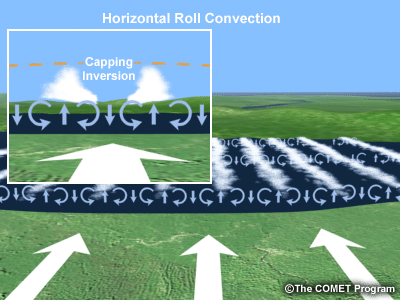
Here is a blow up of the cloud streets. They occur when the atmosphere is relatively unstable at low levels with air rising in the clouds and sinking between them. The wind direction is roughly parallel to the lines.
This feature, also known as convective rolls because of the nature of atmospheric circulation, reflects an atmospheric instability that occurs when the lower atmosphere has a large change in both temperature and wind with height (see schematic below)
 |
| Courtesy of the UCAR COMET Program |
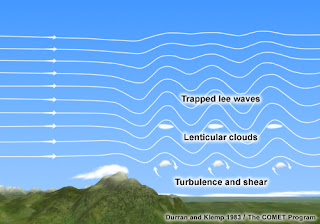
The day before, as the storm approached Oregon, the region was covered by trapped mountain wave clouds, again with lines of clouds and clear areas.
But the mechanism of these clouds are completely different than the cloud streets, being associated with atmospheric waves forced by the mountains (see schematic below). For mountain wave clouds, the winds near crest level are oriented perpendicular to the cloud lines.
_______________________
How will Northwest Weather Change Under Global Warming? Help Us Determine the Local Impacts of Climate Change
Society needs to know the regional impacts of climate change and several of us at the UW are trying to provide this information with state-of-the-art high resolution climate modeling. With Federal funding unavailable, we are experimenting with a community funding to build this effort. If you want more information or are interested in helping, please go here. The full link is: https://uw.useed.net/projects/822/home All contributions to the UW are tax deductible.


You say that images are available, but there are no links to serving sites. Might uninformed me recommend http://www.goes-r.gov/multimedia/goes-16DataAndImagery.html as a starting place? No doubt a better "gateway" to these data exists, but I found a good start here.
ReplyDeleteWhen will the NWS would put the new images on their web sites along with all the other various satellite image types?
ReplyDeleteSeems like the early data for GOES-16 are scattered in many places on the net. The best image source I have discovered is at RAMSDIS Online on the GOES-R Proving Ground Real-time Products page http://rammb.cira.colostate.edu/ramsdis/online/goes-r_proving_ground.asp
ReplyDeleteThe first section has a nice selection of color imagery and loops. The 4-week archive is a great feature. Here's a custom loop of the 7 April storm https://goo.gl/HZflHp
(Hope it's ok to use shortened url's for the really long links.)
An impressive full-disk 24-hr color loop showing last week's intense storm spinning off Oregon and Washington is here https://goo.gl/2iF7ur
The Loop of the Day page has many interesting loop examples back through early March. Some of these are also on the goes-r.gov site.
Any news yet if GOES-16 ends up in the West or East slot?
This comment has been removed by the author.
ReplyDeleteCan I ask a random question? I live in North Seattle, and this morning, I checked Weather Underground, and the stations all around me said that the temperature was hovering around 40 F. Yet I go out to my car, and there's ice on the windshield. Can ice/frost form even though the air temperature doesn't drop below freezing? My house is in a bit of a depression on the top of Maple Leaf hill. Could the fact that I'm in a bowl mean that the temperature at my house is lower?
ReplyDeleteThis report from the NIH describes experiments conducted by the EPA on adults and children in order to prove their thesis on Climate Change:
ReplyDeletehttps://ehp.niehs.nih.gov/1103877/
Regardless of the voluntary nature of some of the subjects, this policy is illegal (according to both US and International law) and highly immoral, according to the extremely high levels of small particles the subjects ingested while enclosed in very confined spaces. This is not a good way to convince skeptics of the merits of your cause, you could say.
Here is a useful link I was able to make with a hint from Mike Zuransky from
ReplyDeleteCollege of DuPage - Nexlab .
http://weather.cod.edu/data/goes16/northwest/current/northwest_02_latest.jpg
versus
http://www.atmos.washington.edu/cgi-bin/latest.cgi?vis1km+-notitle