June 16, 2025

The Truth About Minimum Temperature Increases

 The Seattle Times this week published an article, Seattle Nights Are Getting Hotter, that irresponsibly exaggerates the effects of global warming on minimum temperatures in our region.


This sponsored "journalism" by the infamous Seattle Times ClimateLab, is based on a report by a well-known climate change advocacy group, Climate Central.


Before I get a dozen strident emails from climate activists, let me note that global warming, forced by increasing CO2 and other greenhouse gases, is occurring.   The science is clear on this---and I have published many papers on this topic.

At this point, such greenhouse gas warming is on the order of 1.2°C--a little over 2°F.  

Not the end of the world.  

But that is not what is being communicated by the Seattle Times.  

They prominently display a figure from Climate Central that shows an EXPONENTIAL increase in the number of warm nights (see below) using the proprietary CLIMATE SHIFT INDEX.

As we will see, this is scary nonsense.

Why don't they show you changes in temperature?  Because those are unimpressive.


The Seattle Times starts by highlighting the "heat wave" of June 7-9 of this month as an "example" of what will happen in a warming world.  

Just silly.  This was a run-of-the-mill warm period--the kind of short-term warmth that has been observed frequently in the past.

Let me demonstrate this to you.

Below are the temperatures of the last month, with the observed highs and lows shown by the blue bars, and the extreme highs and lows by red and light blue shading.  The brown shading indicates the normal daily range.  During the past month, we have experienced both warmer and cooler than normal periods.  June 8-9 was warmer than normal, but no high temperature records were broken.  

Of the past 30 days, 22  days had low temperatures below the normal lows.    You note the Seattle Times did not point it out.


Of the 30-day warm periods in June, the three days of June 6-9, 2025, came in 47th. Stop the presses!

But it is worse than that.

SeaTac Airport is the last place you would want to use temperature to understand global warming.

Why?  Because of the profound warming influence of the construction of the third runway and massive development in and near the airport. A large (cooling) vegetated area was removed and replaced with a huge area of concrete.

You want proof of the impact of the development?  Here is the plot of summer nighttime mean minimum temperatures at SeaTac.  I have indicated (red bar) the period of construction.  Notice the shift upward?

The mean temperature was roughly 54°F before and 57°F after.   3F increase.


Now compare to the Olympic Airport, where no third runway was added and development was far less (below).

No big jump.  Summer minimum increased from about 48F to 50°F.  Yes, there is warming, but it is not abrupt or extreme.  You would hardly notice this.


Finally, the rapidly rising number of warm nights shown on the Climate Central plot is based on meteorological sleight of hand.  

They start by using an inappropriate station (SeaTac), in which development has caused substantial warming.  Then, they don't show temperature changes (which would not have impressed), but their "climate shift index", based on their artificial (and incorrect) assumptions of changes in probability distributions.   

This index exaggerates change, since only a very small temperature increase can radically increase the probabilities of exceeding some extreme value.  

Very deceptive and wrong.


June 14, 2025

The Northwest Dry Spell Will Soon End

This has been a relatively dry spring, although far from record-breaking.

For example, in Seattle, the precipitation total from March 22 through June 13 was below normal by roughly two inches.   However, the 2025 spring rainfall was not even close to the lowest precipitation total on record, with 34 years having less spring rainfall.

Below is the plot of spring precipitation (March 22-June 13) since the 1940s.  The trend is up, strongly suggesting that global warming is NOT associated with dry springs at Seattle.  

You can see that this year was low, but not even close to the driest year on record.


The models are insistent that rain is on the way after the next few dry days.

The reason is a deep upper-level trough will move over our region later this week, something shown by the European Center forecast for 11 AM on Friday (blue and purple indicate much lower heights than normal at 500 hPa, about 18,000 ft).

Such a trough brings cool, wet weather to our region.


Rain will move in on Thursday and Friday.  The 48-hour total ending Thursday at 5 PM is relatively light over Washington.


The 48h ending Saturday at 5 PM is considerably wetter in the mountains, with light rain over central Puget Sound.


More rain will follow (the 48 h ending 5 PM Tuesday is shown).


Putting it all together, the totals from this morning to 5 PM on June 26 are impressive for this time of the year.

Let me note that no heat waves are expected for the next two weeks, with the temperature being chilly next Friday and Saturday.

 
Finally, let me note that this spring has not brought serious cold waves like the previous years.  Cold waves can damage important crops such as cherries.   

The plot of temperatures at Wenatchee (below) illustrates this fact. No major cold excursions!


Without major spring cold waves, the WA State cherry farmers expect an excellent and sustained harvest.

Good news for all cherry lovers (like myself).


June 12, 2025

Iranian/Israel Weather

 With the outbreak of hostilities in Iran, it is of interest to examine weather conditions over the region.

The visible image earlier today shows cloud-free skies over that country, which is obviously beneficial for those looking for targets. 

The models show such fair conditions continuing, with some clouds building during he warmer period of the day.  To illustrate, here is the cloud forecast around 4 PM Iran time tomorrow.


Surface air temperatures during the day are very warm.  Here are the high temperatures from yesterday.  Around 110°F in the southern part of the country, cooling to around 90°F in the north.


In Tehran, temperatures should rise to around 100°F each day, with virtually no chance of rain.   Few clouds.


The bottom line is that conditions around Iran will be hot with few clouds and no precipitation.  Good visibility will prevail.

Israel will also be mostly cloud-free during daylight hours (see visible image today).


Low clouds are forecast to form in the morning (see below), which might be an issue for their laser-based protective defense "dome" in some locations.


High temperatures in Israel, moderated by the Mediterranean, are more moderate than over Iran, with highs yesterday only around 90F


June 10, 2025

Cooler Air Means Greater Wildfire Threat

 It may seem counterintuitive, but it is true.   

The movement of cooler air into western Washington and Oregon means an enhanced wildfire threat east of the Cascade crest.

The pressure pattern started to change yesterday as cooler marine air started to migrate into western Washington and Oregon.   

Consider the 24-h difference in temperature between 5 PM today (Tuesday) and yesterday.  Major cooling is evident from the Olympia to Eugene (around 10F) and single digit cooling over most of the remainder of the area.

You will also notice some crazy large cooling over southeast Oregon.


Why such cooling there?  Because some strong thunderstorms moved into the area, something shown by the weather radar image around 5 PM (below).


These thunderstorms provided welcome rain over a wide area of eastern Oregon. 


The movement of cool (denser) air into western Oregon and Washington resulted in rising pressure, which produced an increasing pressure difference (gradient) across the Cascades (see forecast pressure map for 5 PM Wednesday). The solid lines are isobars, lines of constant sea level pressure.


Air speeds up as it moves from high to low pressure, with a large acceleration (from west to east) over the Cascades.  These strong westerly winds then descended the eastern slopes of the Cascades.

Here are the maximum winds today.  You will see 30-40 mph winds over the eastern side of the Cascades--that is due to the large pressure difference.  See the crazy strong winds over southeast Oregon?  Those are from the thunderstorms.


You can see the wind speed up at Ellensburg starting around noon yesterday, with gusts today getting near 40 mph.

Such strong winds are a real wildfire threat in many ways.  They can help start fires (e.g, by damaging powerlines) and any fires to expand rapidly.  

Just as wind accelerated yesterday, a fire started just east of Cle Elum (the Red Creek Road Fire), which is not around 50 acres.


Looking into the future, the winds east of the Cascades will increase further as western Washington cools more as deeper cool air floods the region.

The forecast from 8 PM tomorrow has strong winds pushing over and down the Cascades' eastern slopes.   

Yes, cooling can result in an enhanced wildfire threat.


June 08, 2025

June Gloom Ahead

 Today is probably going to be the warmest day of June for western Washington, with highs this afternoon rising into the mid-80s  over much of the western lowlands.

Lots of sun.

But during the next week, there will be a major transition, with cooler, cloudy marine air pushing into western Washington and Oregon.

You know what it is called:  June Gloom

The visible satellite image shows the lurking "gloom," and by that I mean extensive low clouds over the Pacific (below)

You can see the clouds are low, since they are blocked by the coastal mountains.  Clouds are along the coast from central Oregon to San Diego.

Clear conditions along the Washington Coast are associated with offshore-directed flow, pushing dry continental air offshore (see map around 2500 ft at 11 PM Saturday).


This flow is now starting to weaken and will reverse during the next few days.

Later in the week, low clouds will dominate over western Washington and Oregon, as shown by the cloud forecast for Friday morning.

The predicted temperatures at Seattle by weather.com show the large, gloom-bound transition, with 80s making way to mid-60s by the end of the upcoming week.

Why the change?

Our current warming is associated with high pressure aloft, which produces sinking air, offshore-direction flow, and clear skies (see map below at 500 hPa pressure, about 18,000 ft).  Red indicates higher than normal heights and pressure, and blue, below normal.


By late this week, the ridge of high pressure will be replaced by a trough of lower heights/pressure just offshore.  This pattern will bring cooler temperatures and a chance of rain, particularly over Oregon.


Talking of rain, here is the predicted total precipitation through Friday.   Eastern Oregon will get some thunderstorms and showers.

One week later, western Washington will have joined the wet fun (see below for predicted totals through 23 June).

The NOAA 6-10 day forecast is predicting cooler and wetter than normal conditions over western Oregon and Washington.


June 05, 2025

A Dry May and a Warm Weekend Ahead

May was a relatively dry month for much of the Northwest, with the area getting about 65% of normal precipitation.  Not the driest May on record by any means, but drier than normal at most locations.

The climatological average rainfall for May over the Northwest is shown below.  About 2 inches over the western lowlands and 3-6 inches over the mountains.  Less than an inch over much of the Columbia Basin.


Here is what actually fell. Yes, we got some rain, but clearly less than normal...about a half inch less than normal over Puget Sound and even drier over the Willamette Valley.   Some decent totals in the mountains.

Looking at Seattle for May (green, this year, brown line, normal), precipitation was about half of normal. Felt like a dry month.


Hoquiam was about three-quarters of normal (below).  Bellingham (not shown) was similar.


In contrast, the Tri-Cities were wetter than normal.


Even with a drier than normal May, western Washington reservoirs are in good shape.  Seattle, for example, has normal storage at this time.

The latest forecasts predict generally dry conditions over the next week, except southeast Oregon (see total precipitation forecast below).  The reason:  a big ridge of high pressure over our region.

Warm Temperatures Ahead

This weekend, a ridge of high pressure will develop aloft over our area (see the upper-level map for 11 AM Saturday).  And it is going to hang around for several days.


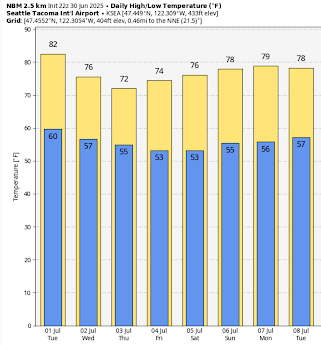
As a result, temperatures will soar into the mid-80s on Sunday and Monday, as illustrated by the forecast temperatures at Seattle below:

__________________

The next serious rain?  The latest forecasts suggest on June 17th!

Announcement

I will hold a special online Zoom session at 10 AM on Saturday for Patreon supporters.  Will talk about the summer outlook, hurricane outlook, and more.  And spend plenty of time answering your questions.

June 03, 2025

Seattle Times Climate Lab Misinforms about Climate Change, Sea-Level Rise, and Seattle Flooding


Demonstrably false information, serious science errors, and continuing misinformation.  

Yes, we are talking about another Seattle Times ClimateLab article.  ClimateLab is sponsored journalism, whereby advocacy groups pay for "journalism", which coincidentally supports the group's positions.   


The story is about flooding in the South Park neighborhood of Seattle, a community built on the floodplain of the Duwamish River.   An area that has flooded regularly for millennia.  

The Seattle Times makes the unfounded claim that human-caused global warming is a major driver of the flooding....suggesting that the major flood of December 17, 2022, demonstrates that this neighborhood is "on the front lines of climate change".   

The article states that South Park has to "brace for climate change" and by mid-century (2050) that the water level should rise by another foot.

As I will prove below, the Seattle Times claims are clearly contradicted by clear scientific evidence.  

Go back to the 1890s, and the South Park area was a mud flat the frequently flooded (see map from 1894 below.

As one would expect of the flood plain of the Duwammish, this area has flooded many times during the past 130 years-- hardly requiring global warming, which only became significant in the 1970s and 1980s.

The recent Times article highlighted the major South Park flood of December 27, 2022.  This event brought flooding to the South Park area as water levels rose to 15 feet MLLW, the mean lower low water level, which represents the average of the lowest low water for each day, calculated over a 19-year period. 

The water was very high because of several factors occurring simultaneously:  a very large astronomical King Tide associated with the moon and sun being aligned during a favorable time of the year, very low and unusual atmospherc pressure (which caused water levels to rise), and heavy prior rain, that revved up the Dumaamish River.

None of these were associated with global warming.

The Seattle Times seems to think that the key element of the local sea level rise is a warming world. 

Don't get me wrong. Global warming HAS caused water levels to rise very slowly, but so slowly that its effects are essentially in the noise level for big events like the flood in question..  

Let me prove this to you.  Below is the sea level trend at Seattle starting in 1900.  Note that sea level has been going up for a long time--- including earlier periods (before 1970) when human-caused warming would be very small.

On average, Seattle's sea level has risen about 2.09 mm (.08 inches) per year.  So over the past fifty years, a period where rising CO2 levels and associated warming became significant, the sea level in Seattle rose about 4 inches.


So perhaps 4 inches of the 15 feet of the extreme water level during that 2022 flood MIGHT be explained by human-caused global warming.

That is TWO PERCENT.  I repeat 2%.   So why in the world is the Seattle Times ClimateLab pointing its finger at global warming?   Such claims are contrary to data.

 I think you know why.

But it is worse than that.  Considering the sea level was rising before human CO2 emissions were significant, how do we know that some of the recent rise was not natural?  In fact, that seems more likely than not.

And to add to the climate change hype, the Seattle Times suggests that Seattle's sea level will rise another foot by 2050....25 years from now.  This is silly.

 Since there appears to be no acceleration of the sea level rise in Seattle during he past decades, let's extrapolate the historical rate for 25 years.  You get 2 inches.  Still very small.

Go crazy, double that amount.  Still very small compared to astronomical and meteorological factors that are independent of global warming. 

The Truth About Minimum Temperature Increases

 The Seattle Times this week published an article, Seattle Nights Are Getting Hotter , that irresponsibly exaggerates the effects of global ...