Hundreds of lightning strikes occurred across the region over the weekend, with some folks enjoying over an inch of rain as a series of thunderstorms moved through.
There was even sizable hail.
Several of you have asked me why this occurred. What unusual conditions had to come together to produce such prodigious boomers?
To begin, below are two regional lightning maps for the 24 hours ending 1 AM Sunday and today (Monday).
The first period was the big one, with massive lightning over and west of the Cascades. Eastern WA got a piece of the action as well.

The lightning distribution on Sunday was mainly limited to western WA and the nearby Cascades.


Take a look at the precipitation totals on the western side of Washington Cascades (below). One location in Bellevue, associated with a powerful thunderstorm moving up the east side of Puget Sound, received over 3 inches!

Why so many strong thunderstorms over the weekend?
Thunderstorms are associated with instability in the vertical. Periods when the air percolates like the hot cereal in your stovetop saucepan. Or in a lava lamp (see below). Another name for this turbulent atmospheric situation is convection.
To produce atmospheric instability, a necessary condition is a rapid decline in temperature with height.
Another necessity is a source of lift--upward motion--to help get the instability going.
Finally, a relatively moist atmosphere is highly conducive to instability and thunderstorm development.

To make the temperature decrease rapidly with height you need to warm the air at low levels, or cool the air aloft, or DO BOTH.
Warm air near the surface is good for instability, but that is a problem in western Washington since cool marine air near the surface makes instability much harder.
And most of the year our low-level air is from off the ocean!
Cooling aloft (say from 5-20 thousand feet) can help provide a big change in temperature with height (also known as a lapse rate, by the way). In fact, many of our thunderstorms and convective activity are associated with cold air from Alaska or Siberia passing over the relatively warmer Pacific Ocean.
The satellite picture below shows you such a situation, with the popcorn-like clouds indicating instability and even some thunderstorms.

We need lift!
Even if the temperature declines rapidly with height, it is important to have some general upward vertical motion to help release the instability. Think of the potential instability from the large change in temperature with heights as an explosive and lift as the ignitor.
Upward motion or lift is often strong on the eastern side of upper-level lows or troughs (areas of low pressure aloft), as shown in the schematic below. Importantly, upper-level lows and troughs are often associated with cold air aloft, so they are doubly good at promoting instability.

So what was so special about this weekend?
The upper-level (500 hPa, about 18,000 ft) weather map at 11 PM Saturday is shown below (height--like pressure--is shown by solid lines, wind vectors are indicated and the colors are temperatures at that level). A strong upper-level low is off of Oregon, supplying upward motion over western Oregon and Washington.

Look closely and you will see cooler air aloft over western Oregon and Washington (blues, greens, and light yellow). Cooling aloft increases the temperature change with height...good for instability.
This upper pattern was very unusual, as shown by the graphic below at the same time. This figure shows the upper-level pattern (solid lines), with the anomaly from normal shown by the colors. The low was very unusual (purple colors in its center).

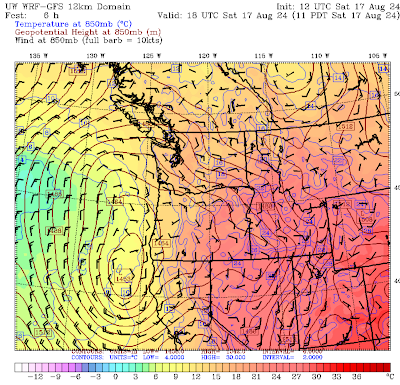
But this is more...... Let's see what was happening at lower levels.
During the day (11 AM), the low was to the south, resulting in southeasterly winds at low levels that brought in warm air over western WA at low levels. The map at the 850 hPa pressure level (about 5000ft) shows the easterly winds and warm conditions over western WA. Helped develop instability!
In the figure below, sea level pressure is shown by solid lines, low-level temperatures (around 2500 ft are indicated by the colors (red and orange indicate warmer temperatures), and surface winds are shown by the wind vectors (for 11 PM Saturday). Temperatures were relatively warm over Puget western Washington with minimal onshore wind.


