Several folks have asked me about the winter extremes of the region, so I decided to do a podcast about it (see below).
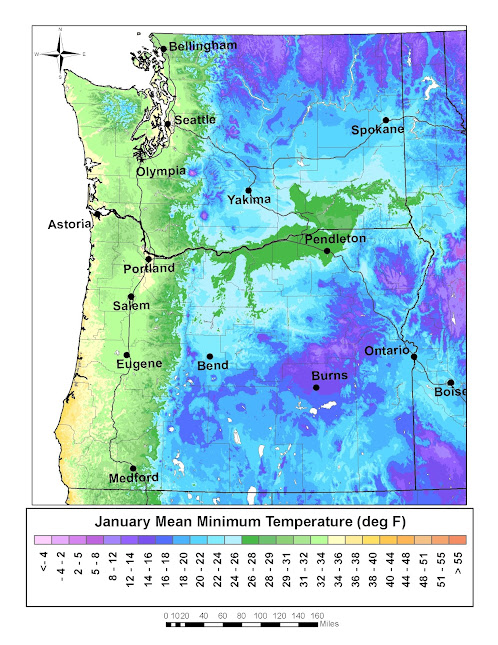
As shown in a map of the average January minimum temperatures below (from my book), the coolest temperatures are found east of the Cascade crest, where marine influence is limited by that mountain barrier. Warmest temperatures are along the coast, where the relatively warm Pacific Ocean keeps things moderate.
Look closely and you will see the warmest temperatures are on the southern Oregon coast from Brookings to Coos Bay. The Banana Belt of the Northwest. As explained in the podcast, the high terrain around Medford plays a large role in this warmth.
And then I take on the issue of the coldest locations of our region, with the Washington records in the high Methow river valley, where cold air sinks down into the towns of Winthrop and Mazama. And there is more....


Nice map. Thanks! I’m a sucker for data maps. I note a counter-intuitive “warm” area in the Willamette Valley down to near Salem. “Counter” because ice storms and Gorge outflow make the news but the average is somewhat better than the surrounding, higher terrain. Here’s another anomaly: I refer to two USDA, Snow/Water Equivalent maps, one for the NW, the other National & regional, that create slightly different impressions. Same data, so how is that possible, and which is most accurate?
ReplyDeleteThe average monthly temperature for December 2022 at BLI was a rather chilly 34.5F - tied with December 1985 as the 10th coldest December in the period of record for the site. It was very slightly colder than December 2021 (by 0.1F) and the coldest December at BLI since that of 2016 which, with an average monthly temperature of 34.1, was the 8th coldest December in the BLI period of record.
ReplyDeleteAlso, with just 3.28" of precipitation at BLI (~76% of normal), it was the 16th driest December in the period of record at that location and the driest December since 2013.
ReplyDelete