The answer: most of the region has enjoyed near-normal or above-normal precipitation.
As a result, our region is going into the new year in pretty good shape regarding water.
Starting with snowpack, Oregon is crazy above normal and Washington is modestly above normal overall (see percentages as of today, below). California is in good shape as well.
Meteorologists and water resource managers pay close attention to the precipitation starting October 1, the beginning of the "water year" and our wet season. The figure below shows the difference from normal from October 1 through December 31. Northern California, Oregon, and eastern Washington are all well above normal. Most of western Washington is nearly normal, with a slightly below-normal area over the South Sound.
With such healthy precipitation totals, it is not surprising that river streamflow is in good shape (see below). Most of Washington is near normal (light green), with several above-normal reports (blue dots). Far more above-normal streamflow sites in Oregon.
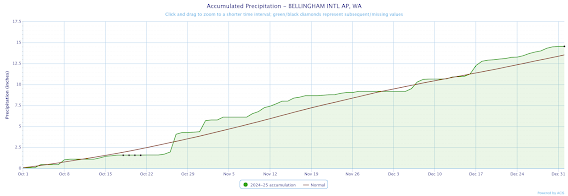
It is interesting to look at some individual sites, plotting the cumulative precipitation against normal from October 1 to today. (from line shows the normal values)
Quillayute, along the north coast, ended up well above normal.
Bellingham was a bit wetter than normal.
Seattle, rainshadowed by the Olympics this fall, was modestly drier than normal.
And Portland was above normal.
Eastern Washington was very much wetter than normal this fall.
Spokane ended up several inches above normal.
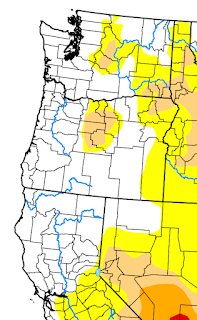
Considering all this, it is surprising that the U.S. Drought Monitor graphics shows dry condition to moderate drought east of the Cascades (see below). I am concerned about the Drought Monitor, which is popular with many media outlets.


The three SNOTEL sites just to my north (Grouse Camp being the nearest at 13 miles) are >150%. More snow in Jan/Feb could set up the EBRG area for heavy spring melt season. It has been cold enough up there (above 5,500') for the snow to stay.
ReplyDeleteSeattle Times' Climate Lab reported on the drought conditions in the Yakima basin last week. They seem to have a thesis that climate change is responsible for any and all negative affects of weather. The reporting feels like someone is always crying, "Wolf" especially when statistics don't support this.
ReplyDeletePretty simple.. generating fear is how they attract attention to themselves. Nothing more to it.
DeleteHey Cliff, I noticed an interesting note on NWCC site. I was looking at snowpack data and noticed that you can compare the 1981-2010 basin normal SWE with the 1991-2020 basin normal SWE. The results were quite interesting. According to this site, the Olympic Basin for example has a median peak SWE for 1991-2020 that is 40% higher than the 1981-2010 normal. Central Puget Sound was modestly higher, but still higher with a median 9% above the '81-'10 peak. North Puget Sound, almost 30% higher for the '91-'10 period. It seems the bar for what "normal" is moved up significantly when the 30 year averages were revised in 2020. Any insight on why we use 30 year data vs. a longer period? If we included the data prior to '91 our median SWE peaks would be lower.
ReplyDeleteOlympic: https://www.wcc.nrcs.usda.gov/ftpref/support/basin_norms_comps/WTEQ/assocHUCwa_8/olympic.html
Central Puget: https://www.wcc.nrcs.usda.gov/ftpref/support/basin_norms_comps/WTEQ/assocHUCwa_8/central_puget_sound.html
North Puget: https://www.wcc.nrcs.usda.gov/ftpref/support/basin_norms_comps/WTEQ/assocHUCwa_8/north_puget_sound.html
30 years was selected by the weather folks in 1934 for reporting purposes so that an adult over 30 could reasonably be expected to compare personal experience with what got reported in the newspapers. There were no computers so calculations were done by hand. Out of this came "Climate Normals" {note the CAPS}, being a definition somewhat as "Love" is in tennis.* "Normal" being perhaps a poor choice because it already had other meanings.
Delete"At its 1934 Wiesbaden meeting the Commission designated the thirty-year period from 1901 to 1930 as the reference time frame for climatological standard normals. the baseline for measuring climate fluctuations."
[ International Meteorological Organization - Wikipedia ]
We live 3 miles SE of Port Angeles at 670 feet elevation. Our rain gauge has recorded 23.5 inches precipitation since 10/1/2024 and 47.5 inches for the calendar year. Both figures are well above published averages for Port Angeles. No drought here!
ReplyDeleteI think you need to check your rain gauge up close and personal. I live a few miles East of you and I've recorded about half of what you have reported. The WunderWeather sites in our area do not agree with you. You are way off.
DeleteYou might be looking at the metric (centimeter) and not inches. that would mean it's about 18" for the calendar year and about 9 inches since 10/1 which is close to what I've recorded.
DeleteKBLI actually had a top-5 wettest calendar year on record during 2024 but, thankfully, with no flooding! This followed the top-5 driest calendar year that occurred during 2023. Interestingly, unusually wet years following unusually dry years (and vice versa) is a regular, albeit infrequent, occurrence at this location. 2023-2024 is the third instance in the POR of consecutive top-5 wettest/driest (or driest/wettest) years. The previous instances were 1984 (top-5 wettest) and 1985 (top-5 driest), and 1952 (top-5 driest) and 1953 (top-5 wettest).
ReplyDeleteThe epicenter of + annual precipitation anomaly in Whatcom County was the area northeast of Bellingham, represented by the Clearbrook weather station located between Lynden and Sumas (POR 1903-present), which had its second wettest calendar year on record with nearly 62"!
Could the drought monitor be reacting to increased demands for water due to agriculture?
ReplyDeleteAs a resident of Yakima I can certainly confirm we've had wet weather! November and December were the wettest I can recall; also the warmest. I'm involved in the wine industry and chances to make ice wine, where we need very cold temperatures to harvest hanging grapes for ice wine, just haven't been present.
ReplyDeleteOur home rain gauge in Wenatchee has us at 5.5 inches since October. Gentle rains and wet snow melting quickly and slowly replenishing our soil But, the Wenatchee area was far below precipitation since April 26 w/ .3" of rain. Only occasional light rains over the summer. So, I tend to think the Drought monitor might reflect Chelan/Douglas co.
ReplyDeleteThe "drought monitor" relies almost entirely on USDA SNOTEL data, when (a) there aren't all that many SNOTELS, and (b) some of those are kinda unreliaible. I think some of the most reliable precip data available is through CoCoRaHS (rain, hail, snow) - where tons of people report at the same time every day using the exact same physical (4") gages following the same protocols for rain, snow, hail, frost - all sorts of details. There's a map that anyone can access for free anytime - with a "dot" that you can click on for each site, and there's a "Data Explorer" ink for each of the stations that provides graphs, charts - many spanning years.
ReplyDeleteLINK: https://maps.cocorahs.org/ Scroll in, drag to any station in the entire country; click on stations then check out the information available at the "Data Explorer". You'll have to experiment with various date ranges (and some people DO fail to report daily) - but it's very information rich. Much better IMHO than almost anything else.
Important Notes: There are numerous topical tabs at the top of those CoCoRaHS "Data Explorer" pages. Date ranges for data for those topics are changed by using the SHORTCUT choices, then clicking on UPDATE. "Year to date" returns calendar data (Jan-Dec); "Water Year" is (Oct-Sept). There's a surprising amount of daily information available for tens of thousands of locations nationwide. Again, the 'big map' can be found at this LINK: https://maps.cocorahs.org/ While instruments that feed precip data online to Weather Underground are useful, the CoCoRaHS data is direct observation using 'physical gages' that are the same. If you want to 'dig data' and follow patterns, I suggest you add this resource to your list.
DeleteThank you, Professor Mass, for the insight into just how wet things have been in recent months. The below normal areas over the South Sound, Astoria, and the Long Beach Peninsula are a bit concerning, though. Are those the result of rain shadowing, or is there something else that is hurting rainfall totals in these areas?
ReplyDeleteIt’s possible that “the drought monitor” utilizes information from an apparently unreliable water monitoring system. Proof being their own map which indicates drought because the sites don’t work. https://nwcc-apps.sc.egov.usda.gov/imap/#version=169&elements=&networks=!&states=!&counties=!&hucs=&minElevation=&maxElevation=&elementSelectType=any&activeOnly=true&activeForecastPointsOnly=true&hucLabels=false&hucIdLabels=false&hucParameterLabels=true&stationLabels=&overlays=&hucOverlays=&basinOpacity=75&basinNoDataOpacity=25&basemapOpacity=100&maskOpacity=0&mode=data&openSections=dataElement,parameter,date,basin,options,elements,location,networks&controlsOpen=false&popup=&popupMulti=&popupBasin=&base=esriNgwm&displayType=station&basinType=6&dataElement=WTEQ&depth=-8¶meter=PCTMED&frequency=DAILY&duration=I&customDuration=&dayPart=E&monthPart=E&forecastPubDay=1&forecastExceedance=50&useMixedPast=true&seqColor=1&divColor=7&scaleType=D&scaleMin=&scaleMax=&referencePeriodType=POR&referenceBegin=1991&referenceEnd=2020&minimumYears=20&hucAssociations=true&relativeDate=-1&lat=43.335&lon=-120.811&zoom=5.7
ReplyDelete