The atmospheric river has reached the Pacific Northwest and moderate rain has spread across much of the region.
The water vapor satellite imagery is impressive, showing a potent plume of water vapor moving northeastward from off the Pacific (see below). Looks scary, doesn't it?
Some folks rate atmospheric rivers like hurricanes and tornadoes, and they rank this event as an AR4 (atmospheric river, category 4), out of a possible 5.
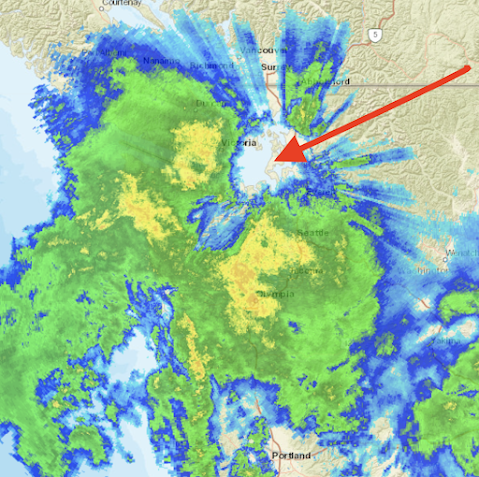
This atmospheric river not only has moisture, but strong winds from the south-southwest, producing a very impressive rainshadow to the northeast of the Olympics (see radar image at 7:30 PM below). Yellow and orange indicated the heaviest precipitation, with the southeast side of the Olympics getting the worst of it now. In contrast, it is TOTALLY dry from Sequim to northern Whidbey Island in the rain shadow. So if you want to go on an evening stroll...you know where to go.
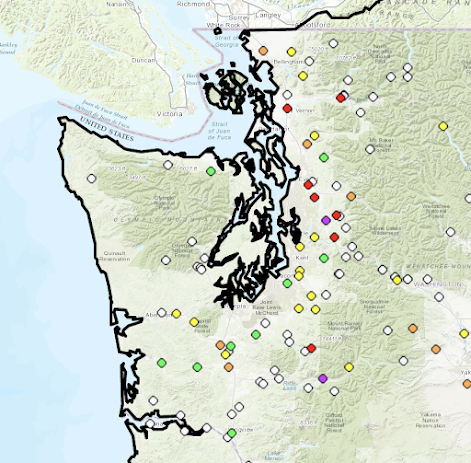
The precipitation total so far (through 7 PM) is shown below. Over an inch has accumulated on the southwest flanks of the Olympics and some favored areas in the Cascades, but only .01 inch on southern Lopez Island in the San Juans. And folks, this is just the beginning.
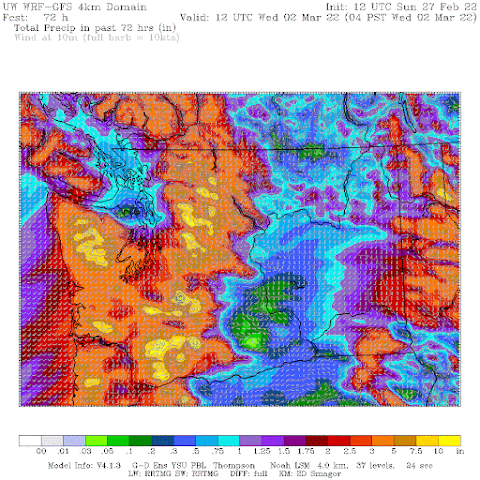
The latest precipitation forecast starting from 4 PM today (Sunday) through 4 PM Tuesday from the NOAA HRRR model predicts 5-10 inches in the mountains, with even heavier precipitation in the southern Washington Cascades. 3-5 inches over southern Puget Sound. That is unusual. Expect some urban flooding.


"We have the most extreme gradients of rainfall in the world." That's surprising, I would think Hawaii, Kauai specifically, would have more extreme gradients.
ReplyDeleteThis was my reaction as well. Or any number of other mountainous trade wind islands. For larger scale, is Patagonia comparable? And if the lee elevation isn't a constraint, then the Himalayas during the monsoon and the Andes between Bolivia and Peru also have very extreme gradients. Perhaps there are certain spatiotemporal scales, upstream/lee altitude, or meteorological pattern constraints that are required for this statement to be true?
DeleteWell, we should determine this quantitatively. We regularly have 100 to 1 ratios over short distance. Occasionally, 500 to 1. Kauai may approach this. Check out the precipitation distribution during the great Kauai flood on April 14-15, 2018:http://www.soest.hawaii.edu/MET/Dept/meteorology/Faculty/businger/PDF/MurphyBusinger2010MWR3357.pdf
DeleteIn any case, the precipitation gradient across the Olympics are world class...and certainly in the top rank..cliff
A great local example of this precipitation gradient is the Dungeness River which flows north from the Olympic Mountains (headwater rainfall about 150-200 inches rainfall a year) to Sequim (about 23” of rain a year) in only 28 miles (156 sq mi drainage area). I am not aware of any river of in the mid-latitudes which compares. Atmospheric rivers from the southwest and a perfectly formed (radial drainage) and placed mountain range are what does the trick. This NW land and air interaction is simply amazing.
DeleteHow does this compare to 12/21/2020 and 12/20/2019? Had significant basement flooding those days and want to nail down the hourly rain threshold where I should start worrying. Where can I see/get hourly precipitation history that old? My zip is 98136.
ReplyDeleteWith the amount of snow/rain that's fallen in the past 48hrs surely we won't hear the word "drought" for the rest of this year?! I'm currently working on building an Ark, all are welcome!
ReplyDelete