During the past week, several Seattle Times articles have been headlining that western Washington is experiencing a "false spring."
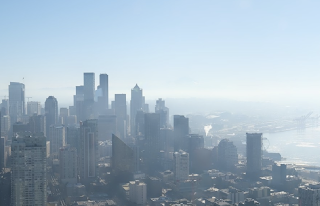
Seattle Near Noon Today
Furthermore, some environmental groups are warning that false spring is threatening wildlife and that false springs are the result of climate change (global warming).
So for those of you worried about the "false spring" threat, let me note that Seattle is NOT known for false springs, that we have some of the longest springs in the nation, and there is NO evidence that a warming planet is producing more "false spring" warm-ups in our region.
Spring 101
Everyone knows that astronomical spring runs from roughly March 21-June 21st. But meteorological spring can be very different, depending on your definition.
Here in Washington State, I have suggested that meteorological spring typically starts around the third week of February (yes...next week!).
My reasoning? The probability of strong Pacific cyclones, atmospheric river flooding, and lowland snow drops rapidly after that. The sun is getting rapidly stronger now...and days are longer... so when there are breaks in the clouds and storms, temperatures surge upwards into the 50s and even 60s.
This is normal and typical for our region.
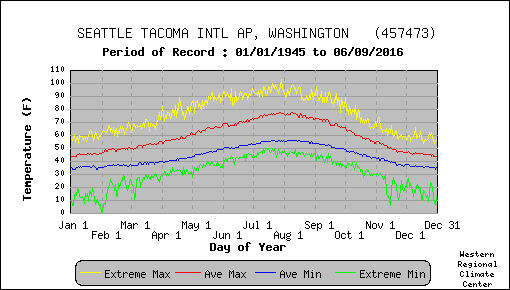
Take a look at the average highs (red lines) and record daily highs (yellow lines) at Seattle-Tacoma Airport (below). Seattle has a slow steady warming from January 1 through mid-July--so our spring lasts a long time. And you will notice that the record high virtually every day in February is in the mid to upper 60s. Nothing unusual.
Sunday's high temperature in Seattle? 57F. Above normal but unremarkable.
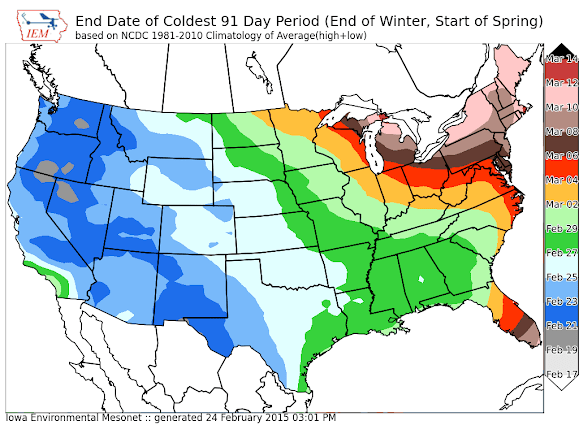
Meteorologists at the Iowa Environmental Mesonet (IEM) have come up with their own approach to define the start of spring: they find the coldest 91-day period of the year (which they call winter), with the next day being the start of spring (see map below). Their analysis suggests the start of spring in western Washington is on February 23-25, dates consistent with my analysis based on storms and snow. Spring ends later over the eastern U.S.
So why does spring start early over western Washington?
I believe the answer relies on the mild Pacific Ocean (which is around 50F all year) and the blocking of cold air by the Rockies and Cascades.
It is difficult for western Washington to really chill down. Onshore flow brings in mild Pacific air and the Rockies/Cascades stop the cold air from the continental interior from reaching us--keep real winter at bay. Soil temperatures never get that cold and we rarely have snow coverage of any real depth.
So if we are relatively mild all year, as soon as we get into February, with is stronger sun, temperatures can warm to "springtime" levels if we get a break in the clouds. Nothing unusual at all. No false spring.
Are Spring Record High Temperatures Increasing?
There are some stories suggesting that "false springs" are getting more frequent or warmer. Is this true? Are we seeing more record high temperatures in spring?
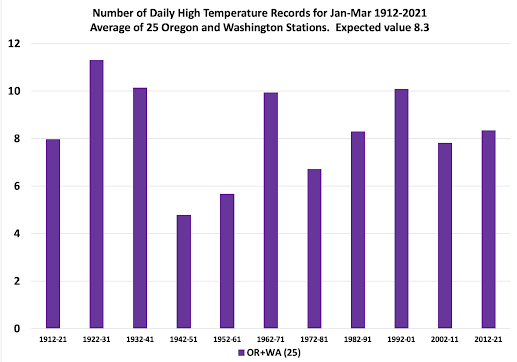
Professor John Christy of the University of Alabama, and Alabama State Climatologist, ran the numbers (see below). There is no trend toward more daily high-temperature records over Oregon and Washington from January to March. So no hint of an increasing "false spring" menace.
The Bottom Line
There is no false spring phenomenon going on around here. False springs are not increasing due to global warming.
Perhaps it is a slow news day at the Seattle Times and a few other media outlets that repeated their story.


Please add a footnote concerning worsening air quality/more air stagnation in Puget Sound region, and down coast through San Francisco, today. Thank you Cliff.
ReplyDeleteWhy? that isn't what the article was about.
DeleteIt's unclear what "daily high temperature records" means, or how it refutes the claim in that article you screenshotted (but, as usual, didn't link).
ReplyDeleteIt seems like you'd want to measure how often sustained warm periods were followed by a cold snap, which is the thing that the article is concerned about.
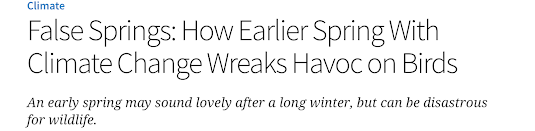
Article is here if anyone wants to read the source: https://www.audubon.org/news/false-springs-how-earlier-spring-climate-change-wreaks-havoc-birds
Thank you for posting the link. The minutai matters. Remember Cliff that over all climate chang is happening, but no we don't need to sensationalize it we need to get off our duffs and do something about it every day in every way we can.
DeleteThere is an opportunity cost to everything. Every dollar that goes to climate change diverts money from other environmental concerns. Sadly, there isn't an "intersectionality" concept that's scientifically valid either. So making CO2 the only priority has other environmental costs, both directly and indirectly.
DeleteThank you for that linked article.
DeleteVanZandtGrrl - there are realistic options available right now, if the Enviros and their assorted NGO's would get off their duffs and do something about it, any way they can.
Deletehttps://hardware.slashdot.org/story/22/02/13/239255/declaring-renaisance-for-french-nuclear-industry-french-president-promises-up-to-14-new-reactors-by-2050
So the far - left Macron seems to get it, why can't we?
Can you explain the red sky sunset in Seattle and Victoria BC on Sun Feb 13 2022 ?
ReplyDeleteGardening spring is kind of when the roses and blueberries start to bud out. Also when you can plant peas. I would say this generally is a week or two before meteorological spring. The three plants mentioned generally react OK to a mild below freezing spell. This couple of weeks are a good time to do a general garden clean up.
ReplyDeleteExactly. "False spring" is a cheeky little joke among locals referring to those nice early spring days where you need to remind yourself you can't plant things outside yet 😆
DeleteJust wait until the one year anniversary of the scorchingly hot and record breaking temperatures the region experienced last year comes up. The MSM will be at ear - splitting levels of hysterics.
ReplyDeleteSome of my crocuses opened on Saturday! And I was in North Bend yesterday for a hike. 64 degrees! But not that warm in Bothell- only 56 for a high.
ReplyDeleteBut where is the convergence zone rain that you promised? I have had barely a drop.
Here is the number of record high days for the same 10-year periods as in Cliff's graph, January thru March, at the Tree Fruit Research Center in Wenatchee for the period 1940 thru 2021:
ReplyDelete1942-51: 6
1952-61: 7
1962-71: 12
1972-81: 9
1982-91: 14
1992-01: 12
2002-11: 12
2012-21: 16
An average of about 5 more record high days during the recent 40-year period, 1982 to 2021, than the previous 40-year period, 1942 to 1981.
It converged on Longview, Ansel! We expected .2", now at .42" here. Large flareup on radar the past hour, reasons unclear.
ReplyDeleteCliff, regarding the chart of daily high temperature records: In a stable environment wouldn't we expect to see the absolute count of "record setting days" start out high (as records are initially recorded) then decrease over time as the normal variation stays increasingly within the bounds of the increasingly large data set?
ReplyDeleteLooking at the chart I can see high counts from 1912-1941, then the expected drop as those records stabilize. (But I'm not sure how large the data set is prior to 1912, against which "record days" are being compared) But then we see a steady increase in record setting days from 1942-2021. It seems this would indicate an increasingly unstable system with increasing special cause variation resulting in a growing number of high temperatures exceeding the bounds of of the (increasingly large) data set. Wouldn't this indicate general warming?
What am I missing here?
Tim.... if the climate is stable....then record temperatures should occur randomly in each decade. If you like at that time series, there is variability, but little trend. Obviously, if you only have one decade...all the extremes will fall in that decade, but as you add more decades, the extreme temperatures should spread out relatively evenly if there is no overall warming. Does that answer your question?
DeleteI posted the record of the number of daily high temperature records for January through March for each decade from the observations at the Tree Fruit Research Center in Wenatchee in a previous posting. The number of daily low temperature records for the same months and decades at the TFRC is posted below. ( I am adding the period 1936 to 1941 since the record began in 1936):
Delete1936-1941: 16
1942-1951: 28
1952-1961: 18
1962-1971: 8
1972-1981: 5
1982-1991: 4
1992-2001: 4
2002-2011: 3
2012-2021: 5
This, along with the trend of the high temperature records, seems to indicate the warming trend that has occurred in the recent 40 years or so, especially so in minimum temperatures.
Sunset Magazine and the USDA both show a warming in Western Washington of one climate zone over the last 40 years. Anecdotally, this confirms my own weather temperature experiences in Chehalis area. And in Bremerton in the late 40s and 50s every few years we would ice skate on Kitsap Lake. None of my younger siblings nor their kids/grandkids have done so. Also vivid memories of stomping though the ice on mud puddles on the way to school.
DeleteShowing stability of extremes by decade does not prove the stability of temperature. It shows that extremes continue to be surpassed decade over decade. For example, if your personal best time to run a mile improves 6-8 times a year every year, it does not mean your speed is stable. It proves you consistently move away from the center, assuming your lows frequency and amplitude does not correlate to highs. The fact that Cliff is using stable highs as the smoking gun of proof is odd. Why not look at the average high and lows of the should season in question (Feb 15- March 15). Group those dates into 5 year average groups and then compare whether there appears to be a warming trend as 5 year intervals progress. I'm willing to do this if someone can point me to a good source or raw data? maybe send me a link?
DeleteThis is a good time to repeat my observation that our temp curve is asymmetrical- if the end of the coldest 3 month period is Feb. 24, winter starts about Nov. 24th. But the end if the warmest period is not Aug. 24th! If the hottest day averages July 31, the end if the hottest 3 months is on or about Sept. 15 and it starts June 15. Which makes spring almost 4 months long, but fall is only a bit over 2 months- Sept. 16 to Nov. 23, more or less. But why the faster cool-down than warm-up?
ReplyDeleteTime to install your own ticker on a building somewhere in SLU- run your own headlines like how the Seattle times does around the corner of their building on Denny :)
ReplyDeleteThis would be a good time to point out the asymmetry in our temperature curve. If winter ends Feb. 24, it must begin about Nov 24. This makes winter's coldest period center on January 9-10. But does summer center on July 9-10? No! More like July 31. So summer runs about June 15 to Sept. 15. This means that spring runs nearly 4 months, but fall runs only 2 months and a week- September 16 to November 23. Why is the cool-down so much faster than the warm-up?
ReplyDeleteThat is a great question. I have noticed the same asymmetrical annual pattern in water temperatures here in western WA. Must have something to do with an interaction between the ocean's influence on our climate and changes in atmospheric circulation patterns at different times of year?
DeleteAre you going to attend the Governors townhall? Link below. It would be interesting to here your take. On the page it says warming by 4° by 2100 and we to keep it at 1.5°. Thought we already reached that mark?
ReplyDeletehttps://www.governor.wa.gov/news-media/climate-action-now-virtual-town-hall-wednesday-former-vice-president-al-gore-gov-jay
Why would a respected meteorologist attend an event designed to assuage only the true believers of AGW?
DeleteUnconfortable situation for Cliff I am sure. However could be a chance to to call out the lies these people are selling to the audience and this is the audience that needs to be spoken to. I am a stirrer of the pot, if I had the knowledge and background Cliff, I would go there to stor the pot. Backlash be d$&$^#*, and perhaps change a few minds to settle down a bit and they aren't going to die in 12 years.
DeleteGood point, but when you consider what Cliff underwent when he was literally shouted down by university students only a few years ago during an event, I could understand why he wouldn't bother wasting his time again. These folks aren't interested in any kind of discussion or debate, only complete conformity.
Delete