Question
On Friday afternoon at 4 PM, where would be the better place to put on your sunglasses and go outside for a warm St. Patrick's Day stroll?
Seattle or Los Angeles?
The surprising answer: SEATTLE!
To illustrate the stunning situation, here is the latest European Center surface air temperature forecast at that time. 59F in Seattle and even higher over Chehalis and Portland.
In contrast, about 55-56F in LA on Friday afternoon.
A stroll is enhanced by dry weather. The total precipitation forecast through Saturday at 5 PM, shown below, indicates that Seattle will be dry, with light precipitation in the mountains.
In contrast, during the same period, Los Angeles will be inundated by heavy precipitation, with 1-2 inches through Saturday afternoon from San Diego through Santa Barbara.
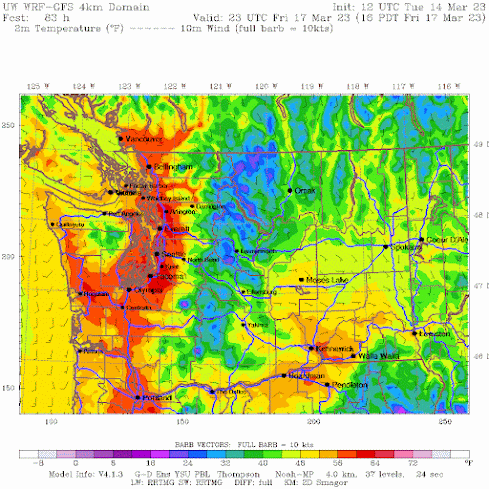
Let's take a closer look at the upcoming warmth, with Friday being the warmest day. Here is the predicted surface air temperature at 4 PM Friday, the warmest hour of that day.
Western Washington will be quite warm, with temperatures ranging from the upper 50s to lower 60s. Temperatures will be cooler in eastern Washington.
Why are we enjoying this warm/dry bounty? On Friday afternoon there will be high-pressure inland and lower pressure offshore, resulting in easterly (from the east) flow over the Cascades (see below for 2 PM Friday). Thus, air will be compressed (and warmed) as the air descends the western slopes of the barrier.
I asked the machine learning app, Dalle-E, to show me how the nice weather will change Seattle. Its answer is below.


For those who are interested in the subject of whether an increase in extreme weather events could be related to global warming, there is a recent study published in one of the Nature journals (Changing intensity of hydroclimatic extreme events revealed by GRACE and GRACE-FO). This study, which involves one NASA researcher, utilizes direct satellite data. The authors conclude that global warming is increasing weather extremes. Free access to the paper can be found here:
ReplyDeletehttps://www.nature.com/articles/s44221-023-00040-5.epdf?sharing_token=ZkDbvjCRxKpYYlptVMmdlNRgN0jAjWel9jnR3ZoTv0PgIO8qj4_9Dplvo9OtFAjxhHfaCX8VTYLe4towwNokfQHJlbL1eAxOaGOxzDZ8sA0WyyIRTmT5UszYisFZZTu6OXqhnXXWld7HNke8U3pftWI2kbPcpYHf8At-auBUCaWnbYdbP7GYQBBb9RELQ5A3l1FNBvHJdBq5lrzfwfGF7Xn8AiVjMG1P3mCAqvzz9S0%3D&tracking_referrer=www.washingtonpost.com
This is really nonsensical. Did you read the paper? My next blog will be on it. Totally problematic for reasons I will explain...
DeleteI'm definitely skeptical of "extreme event attribution". It appears to me to be a statistical contrivance endorsed, ultimately, by political (power-seeking) rather than scientific (truth-seeking) interests. That said, as a layman, I would be very interested in a dispassionate discussion of the math for non-subject matter experts.
Deleteyou should be skeptical. Most are very poorly done. I did a deep dive into problems with the 2021 heatwave attribution in several blogs. Check that out...
DeleteThe National Weather Service is, as of 3/14, forecasting a 36% chance for a high temperature of 60F or above in Bellingham on 3/17. If this comes to pass it will be the first time since the thirteenth of the exceptionally warm and dry January of 2023 (second only to January, 1994 in Bellingham history in that regard). A temperature threshold much more welcome in early spring than in midwinter!
ReplyDeleteIt seems like everyone has forgotten about January already. Sea-Tac recorded two days in January with a high of 59 degrees and the monthly rainfall total was just over half the historical average. Also only 0.1 inches of snow recorded and that was on the 31st, yet the perception seems to be that this has been a cold, harsh winter.
DeleteIn Bellingham, it has arguably been the second coldest-driest November-February in the period of record which began January 1, 1949. The average temperature for November-February was 38.9F which is the lowest since the 2008-2009 season and the 14th lowest overall for November-February. I would say that's fairly impressively cold.
DeleteIn addition, it's also been exceptionally dry. Total precipitation for the November-February period was only ~11" (data for 11/7-8/22 are missing from the record but my rain gauge, located 2 miles from the weather station at BLI, only measured a few hundredths of an inch which would not affect the ranking) making that the 3rd driest November-February in the record.
The only November-February period in the BLI record that has a higher combined cold-dry ranking is that of 2000-2001, which was the 13th coldest and 1st driest such period overall.
January was mild but that was it, Cliff did a blog on how far below normal the temps have been, and this is from the NWS on March 8th.
Delete"71 days with below normal high temps, 26 above & 3 normal.
70 days have had measurable precipitation, 11 with a trace, 19 dry"
I'm in the south sound area and if you look at the temps for KTCM it's been below freezing 10 out of the last 14 days, and 16 days in February got below freezing. There has been lots of black ice the last 2 months and some heavy freezing fog.
Yes, it felt almost like an Eastern winter- a lot colder and drier than normal for us. And not much from the Pineapple Express. I do actually like warm rain and hope we get some soon (but not to minimize the value of the sunshine).
DeleteWhile the daytime highs may not seem all that cold, we've had a lot of frosty mornings since January.
ReplyDeleteRight now, it's 8:12AM and my car has frost on it so it got down to at least freezing last night with the high expecting to be in the mid 50's in Tacoma. So it's been cold for dang sure, but not terribly wet many days.
We've had some wet days for certain, but most are not that bad, so the water levels may not be as plentiful as they would otherwise be. I think it's a skewed perception we are seeing among many folks.